
Page 271 - Chiral Separation Techniques
P. 271
9.6 Operation of the SMB Unit 249
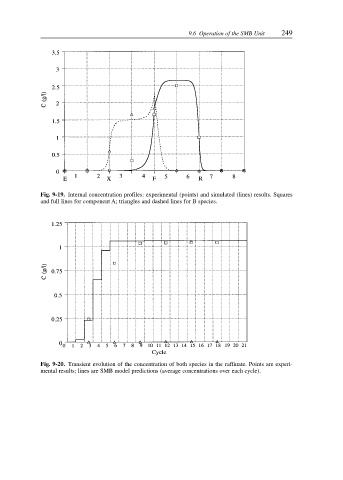
Fig. 9-19. Internal concentration profiles: experimental (points) and simulated (lines) results. Squares
and full lines for component A; triangles and dashed lines for B species.
Fig. 9-20. Transient evolution of the concentration of both species in the raffinate. Points are experi-
mental results; lines are SMB model predictions (average concentrations over each cycle).