
Page 54 - Classification Parameter Estimation & State Estimation An Engg Approach Using MATLAB
P. 54
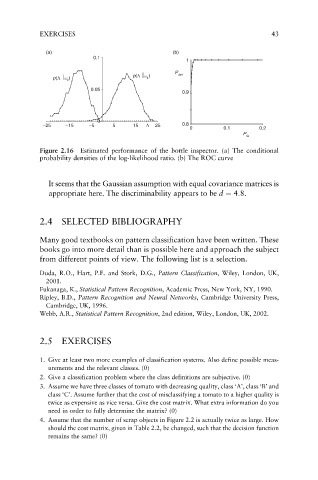
EXERCISES 43
(a) (b)
0.1
1
P
p(Λ ω ) det
p(Λ ω ) 2 1
0.05
0.9
0
–25 –15 –5 5 15 Λ 25 0.8
0 0.1 0.2
P
fa
Figure 2.16 Estimated performance of the bottle inspector. (a) The conditional
probability densities of the log-likelihood ratio. (b) The ROC curve
It seems that the Gaussian assumption with equal covariance matrices is
appropriate here. The discriminability appears to be d ¼ 4:8.
2.4 SELECTED BIBLIOGRAPHY
Many good textbooks on pattern classification have been written. These
books go into more detail than is possible here and approach the subject
from different points of view. The following list is a selection.
Duda, R.O., Hart, P.E. and Stork, D.G., Pattern Classification, Wiley, London, UK,
2001.
Fukanaga, K., Statistical Pattern Recognition, Academic Press, New York, NY, 1990.
Ripley, B.D., Pattern Recognition and Neural Networks, Cambridge University Press,
Cambridge, UK, 1996.
Webb, A.R., Statistical Pattern Recognition, 2nd edition, Wiley, London, UK, 2002.
2.5 EXERCISES
1. Give at least two more examples of classification systems. Also define possible meas-
urements and the relevant classes. (0)
2. Give a classification problem where the class definitions are subjective. (0)
3. Assume we have three classes of tomato with decreasing quality, class ‘A’, class ‘B’ and
class ‘C’. Assume further that the cost of misclassifying a tomato to a higher quality is
twice as expensive as vice versa. Give the cost matrix. What extra information do you
need in order to fully determine the matrix? (0)
4. Assume that the number of scrap objects in Figure 2.2 is actually twice as large. How
should the cost matrix, given in Table 2.2, be changed, such that the decision function
remains the same? (0)