
Page 217 - Complete Wireless Design
P. 217
Oscillator Design
216 Chapter Four
4.1 Oscillator Simulation
4.1.2 Introduction
The following technique of open-loop oscillator design, as well as more LC and
crystal oscillator topographies, can be found in further detail in the classic
oscillator text by Randall W. Rhea, Oscillator Design and Computer
Simulation.
These design procedures, as popularized by both Rhea and R. Matthys, have
made oscillator design a simple and far more repeatable procedure than in the
past. Formally, it was either a horribly mathematically intensive procedure—
with an uncertain outcome—or simply copying a particular oscillator design
and empirically swapping out the frequency-determining components until
the oscillator functioned as close as possible to the desired specifications.
4.1.3 Open-loop design
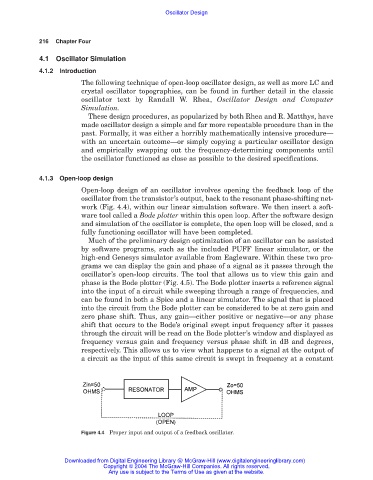
Open-loop design of an oscillator involves opening the feedback loop of the
oscillator from the transistor’s output, back to the resonant phase-shifting net-
work (Fig. 4.4), within our linear simulation software. We then insert a soft-
ware tool called a Bode plotter within this open loop. After the software design
and simulation of the oscillator is complete, the open loop will be closed, and a
fully functioning oscillator will have been completed.
Much of the preliminary design optimization of an oscillator can be assisted
by software programs, such as the included PUFF linear simulator, or the
high-end Genesys simulator available from Eagleware. Within these two pro-
grams we can display the gain and phase of a signal as it passes through the
oscillator’s open-loop circuits. The tool that allows us to view this gain and
phase is the Bode plotter (Fig. 4.5). The Bode plotter inserts a reference signal
into the input of a circuit while sweeping through a range of frequencies, and
can be found in both a Spice and a linear simulator. The signal that is placed
into the circuit from the Bode plotter can be considered to be at zero gain and
zero phase shift. Thus, any gain—either positive or negative—or any phase
shift that occurs to the Bode’s original swept input frequency after it passes
through the circuit will be read on the Bode plotter’s window and displayed as
frequency versus gain and frequency versus phase shift in dB and degrees,
respectively. This allows us to view what happens to a signal at the output of
a circuit as the input of this same circuit is swept in frequency at a constant
Figure 4.4 Proper input and output of a feedback oscillator.
Downloaded from Digital Engineering Library @ McGraw-Hill (www.digitalengineeringlibrary.com)
Copyright © 2004 The McGraw-Hill Companies. All rights reserved.
Any use is subject to the Terms of Use as given at the website.