
Page 218 - Complete Wireless Design
P. 218
Oscillator Design
Oscillator Design 217
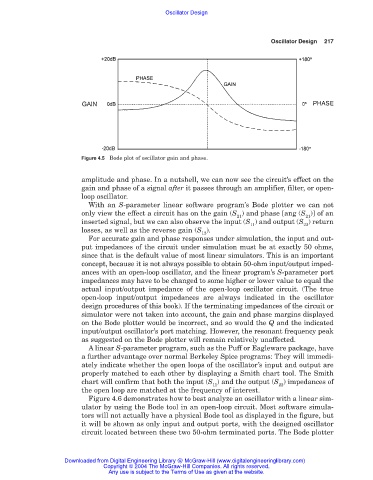
Figure 4.5 Bode plot of oscillator gain and phase.
amplitude and phase. In a nutshell, we can now see the circuit’s effect on the
gain and phase of a signal after it passes through an amplifier, filter, or open-
loop oscillator.
With an S-parameter linear software program’s Bode plotter we can not
only view the effect a circuit has on the gain (S ) and phase [ang (S )] of an
21 21
inserted signal, but we can also observe the input (S ) and output (S ) return
11 22
losses, as well as the reverse gain (S ).
12
For accurate gain and phase responses under simulation, the input and out-
put impedances of the circuit under simulation must be at exactly 50 ohms,
since that is the default value of most linear simulators. This is an important
concept, because it is not always possible to obtain 50-ohm input/output imped-
ances with an open-loop oscillator, and the linear program’s S-parameter port
impedances may have to be changed to some higher or lower value to equal the
actual input/output impedance of the open-loop oscillator circuit. (The true
open-loop input/output impedances are always indicated in the oscillator
design procedures of this book). If the terminating impedances of the circuit or
simulator were not taken into account, the gain and phase margins displayed
on the Bode plotter would be incorrect, and so would the Q and the indicated
input/output oscillator’s port matching. However, the resonant frequency peak
as suggested on the Bode plotter will remain relatively unaffected.
A linear S-parameter program, such as the Puff or Eagleware package, have
a further advantage over normal Berkeley Spice programs: They will immedi-
ately indicate whether the open loops of the oscillator’s input and output are
properly matched to each other by displaying a Smith chart tool. The Smith
chart will confirm that both the input (S ) and the output (S ) impedances of
11 22
the open loop are matched at the frequency of interest.
Figure 4.6 demonstrates how to best analyze an oscillator with a linear sim-
ulator by using the Bode tool in an open-loop circuit. Most software simula-
tors will not actually have a physical Bode tool as displayed in the figure, but
it will be shown as only input and output ports, with the designed oscillator
circuit located between these two 50-ohm terminated ports. The Bode plotter
Downloaded from Digital Engineering Library @ McGraw-Hill (www.digitalengineeringlibrary.com)
Copyright © 2004 The McGraw-Hill Companies. All rights reserved.
Any use is subject to the Terms of Use as given at the website.