
Page 202 - Compression Machinery for Oil and Gas
P. 202
Reciprocating Compressors Chapter 5 191
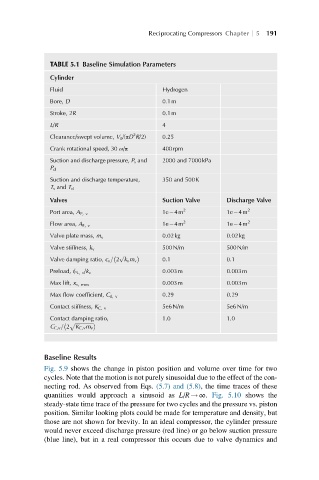
TABLE 5.1 Baseline Simulation Parameters
Cylinder
Fluid Hydrogen
Bore, D 0.1m
Stroke, 2R 0.1m
L/R 4
2
Clearance/swept volume, V 0 /(πD R/2) 0.25
Crank rotational speed, 30 ω/π 400rpm
Suction and discharge pressure, P s and 2000 and 7000kPa
P d
Suction and discharge temperature, 350 and 500K
T s and T d
Valves Suction Valve Discharge Valve
Port area, A P, v 1e 4m 2 1e 4m 2
Flow area, A F, v 1e 4m 2 1e 4m 2
Valve plate mass, m v 0.02kg 0.02kg
Valve stiffness, k v 500N/m 500N/m
p
ffiffiffiffiffiffiffiffiffiffiffi
Valve damping ratio, c v = 2 k v m v 0.1 0.1
Preload, f PL, v /k v 0.003m 0.003m
Max lift, x v, max 0.003m 0.003m
0.29 0.29
Max flow coefficient, C d, v
5e6N/m 5e6N/m
Contact stiffness, K C, v
Contact damping ratio, 1.0 1.0
p ffiffiffiffiffiffiffiffiffiffiffiffiffiffiffi
C C,v = 2 K C,v m v
Baseline Results
Fig. 5.9 shows the change in piston position and volume over time for two
cycles. Note that the motion is not purely sinusoidal due to the effect of the con-
necting rod. As observed from Eqs. (5.7) and (5.8), the time traces of these
quantities would approach a sinusoid as L/R!∞. Fig. 5.10 shows the
steady-state time trace of the pressure for two cycles and the pressure vs. piston
position. Similar looking plots could be made for temperature and density, but
those are not shown for brevity. In an ideal compressor, the cylinder pressure
would never exceed discharge pressure (red line) or go below suction pressure
(blue line), but in a real compressor this occurs due to valve dynamics and