
Page 204 - Compression Machinery for Oil and Gas
P. 204
Reciprocating Compressors Chapter 5 193
–3
10
1.4
Mass in cylinder (kg) 0.8 1
1.2
0.6
0 0.05 0.1 0.15 0.2 0.25 0.3 0.35
Time (s)
–3
10
1.4
1.2
Mass in cylinder (kg) 0.8 1
0.6
0 0.01 0.02 0.03 0.04 0.05 0.06 0.07 0.08 0.09 0.1
Piston position (m)
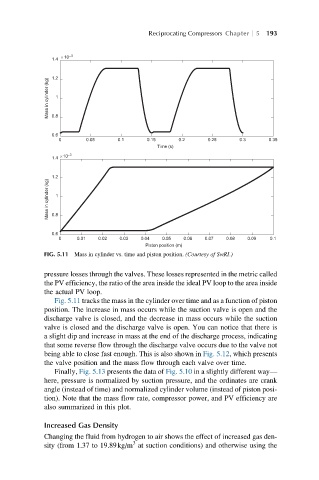
FIG. 5.11 Mass in cylinder vs. time and piston position. (Courtesy of SwRI.)
pressure losses through the valves. These losses represented in the metric called
the PV efficiency, the ratio of the area inside the ideal PV loop to the area inside
the actual PV loop.
Fig. 5.11 tracks the mass in the cylinder over time and as a function of piston
position. The increase in mass occurs while the suction valve is open and the
discharge valve is closed, and the decrease in mass occurs while the suction
valve is closed and the discharge valve is open. You can notice that there is
a slight dip and increase in mass at the end of the discharge process, indicating
that some reverse flow through the discharge valve occurs due to the valve not
being able to close fast enough. This is also shown in Fig. 5.12, which presents
the valve position and the mass flow through each valve over time.
Finally, Fig. 5.13 presents the data of Fig. 5.10 in a slightly different way—
here, pressure is normalized by suction pressure, and the ordinates are crank
angle (instead of time) and normalized cylinder volume (instead of piston posi-
tion). Note that the mass flow rate, compressor power, and PV efficiency are
also summarized in this plot.
Increased Gas Density
Changing the fluid from hydrogen to air shows the effect of increased gas den-
3
sity (from 1.37 to 19.89kg/m at suction conditions) and otherwise using the