Page 349 - Computational Fluid Dynamics for Engineers
P. 349
11.5  Model  Problem:  Sudden  Expansion  Laminar  Duct  Flow         339


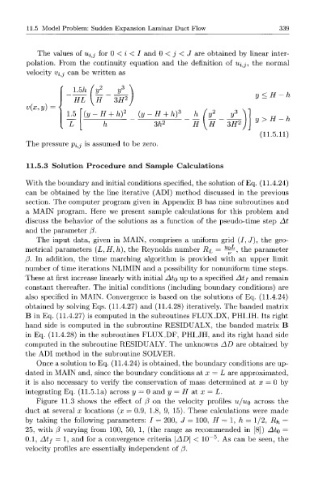
            The  values  of  Uij  for  0  <  i  <  I  and  0  <  j  <  J  are  obtained  by  linear  inter-
         polation.  From  the  continuity  equation  and  the  definition  of  Uij,  the  normal
         velocity  Vij  can  be  written  as


                                                                        y<H-h
         v(x,y)
                                                                        y>     H-h
                                                                   2
                                                                3tf
                                                                         (11.5.11)
        The  pressure  pij  is assumed  to  be  zero.


         11.5.3  Solution  Procedure  and  Sample  Calculations

        With  the boundary  and  initial conditions  specified,  the  solution  of Eq.  (11.4.24)
        can  be  obtained  by  the  line  iterative  (ADI)  method  discussed  in  the  previous
        section.  The  computer  program  given  in  Appendix  B  has  nine  subroutines  and
        a  MAIN  program.  Here  we  present  sample  calculations  for  this  problem  and
        discuss  the  behavior  of  the  solutions  as  a  function  of  the  pseudo-time  step  At
        and  the  parameter  /?.
                                                                      J
           The  input  data,  given  in  MAIN,  comprises  a  uniform  grid  (J, ),  the  geo-
                                                               :
        metrical  parameters  (L,H,  h),  the  Reynolds  number  RL  = ^rS  the  parameter
        j3.  In  addition,  the  time  marching  algorithm  is  provided  with  an  upper  limit
        number  of time  iterations  NLIMIN  and  a  possibility  for  nonuniform  time  steps.
        These  at  first  increase  linearly  with  initial  Ato  up to  a specified  Atf  and  remain
        constant  thereafter.  The  initial  conditions  (including  boundary  conditions)  are
        also  specified  in  MAIN.  Convergence  is  based  on  the  solutions  of  Eq.  (11.4.24)
        obtained  by  solving  Eqs.  (11.4.27)  and  (11.4.28)  iteratively.  The  banded  matrix
        B  in  Eq.  (11.4.27)  is computed  in the  subroutines  FLUX_DX,  PHLIH.  Its  right
        hand  side  is  computed  in  the  subroutine  RESIDUALX,  the  banded  matrix  B
        in  Eq.  (11.4.28)  in the  subroutines  FLUX.DF,  PHLJH,  and  its  right  hand  side
        computed  in  the  subroutine  RESIDUALY.  The  unknowns  AD  are  obtained  by
        the  ADI  method  in  the  subroutine  SOLVER.
           Once  a solution to Eq.  (11.4.24)  is obtained,  the boundary  conditions  are  up-
        dated  in  MAIN  and,  since the  boundary  conditions  at  x  =  L  are  approximated,
        it  is  also  necessary  to  verify  the  conservation  of  mass  determined  at  x  =  0  by
        integrating  Eq.  (11.5.1a)  across  y  =  0 and  y  =  H  at  x  =  L.
           Figure  11.3  shows  the  effect  of  (3 on  the  velocity  profiles  U/UQ across  the
        duct  at  several  x  locations  (x  =  0.9,  1.8,  9,  15).  These  calculations  were  made
        by  taking  the  following  parameters:  /  =  200,  J  =  100,  H  =  1,  h  =  1/2,  R^  =
        25,  with  f3 varying  from  100,  50,  1,  (the  range  as  recommended  in  [8])  Ato  —
                                                            - 5
        0.1,  Atf  =  1,  and  for  a  convergence  criteria  \AD\  <  10 .  As  can  be  seen,  the
        velocity  profiles  are  essentially  independent  of /3.

