
Page 356 - Computational Fluid Dynamics for Engineers
P. 356
346 11. Incompressible Navier-Stokes Equations
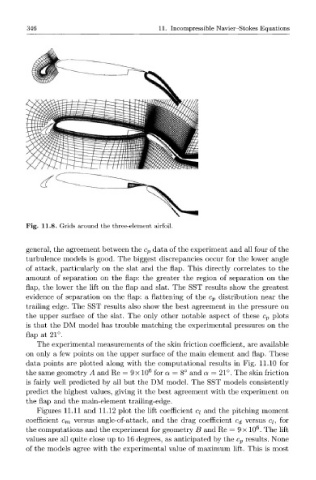
Fig. 11.8. Grids around the three-element airfoil.
general, the agreement between the c p data of the experiment and all four of the
turbulence models is good. The biggest discrepancies occur for the lower angle
of attack, particularly on the slat and the flap. This directly correlates to the
amount of separation on the flap: the greater the region of separation on the
flap, the lower the lift on the flap and slat. The SST results show the greatest
evidence of separation on the flap: a flattening of the c p distribution near the
trailing edge. The SST results also show the best agreement in the pressure on
the upper surface of the slat. The only other notable aspect of these c p plots
is that the DM model has trouble matching the experimental pressures on the
flap at 21°.
The experimental measurements of the skin friction coefficient, are available
on only a few points on the upper surface of the main element and flap. These
data points are plotted along with the computational results in Fig. 11.10 for
the same geometry A and Re = 9 x 10 6 for a = 8° and a = 21°. The skin friction
is fairly well predicted by all but the DM model. The SST models consistently
predict the highest values, giving it the best agreement with the experiment on
the flap and the main-element trailing-edge.
Figures 11.11 and 11.12 plot the lift coefficient q and the pitching moment
coefficient c m versus angle-of-attack, and the drag coefficient c^ versus q, for
6
the computations and the experiment for geometry B and Re = 9 x 10 . The lift
values are all quite close up to 16 degrees, as anticipated by the c p results. None
of the models agree with the experimental value of maximum lift. This is most