Page 46 - Computational Fluid Dynamics for Engineers
P. 46

1.4  Prediction  of  Aircraft  Performance  Degradation  Due to  Icing  31


               0.04
                                                   0.04

               0.02  k
                                                   0.02
          y / c  o.oo h                        y/c  o.oo


              -0.02                                -0.02

                                                   -0.04    _i  .  i_
              -0.04                                  -0.04  -0.02  0.00  0.02  0.04
                -0.04  -0.02  0.00  0.02  0.04
                                                                 x/c
              (a)             x/c                  (b)
              0.04  r                             0.04


                                                  0.02

                                             y/c  o.oo


                                                  -0.02

              -0.04                               -0.04
                -0.04  -0.02  0.00  0.02  0.04      -0.04  -0.02  0.00  0.02  0.04
                             x/c                                 x/c


          y/c  o.oo                          y/c  o.ooo


              -0.02                              -0.020

              -0.04                              -0.040
                -0.04  -0.02  0.00  0.02  0.04      -0.040  -0.020  0.000  0.020  0.040
               (e)           x/c                  (f)             * G
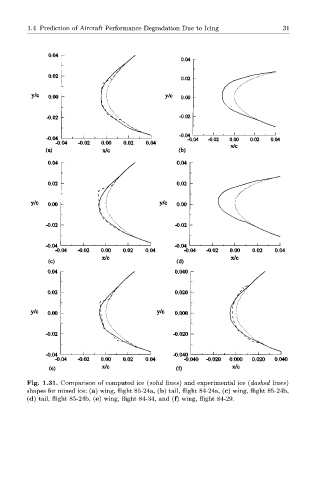
         Fig.  1.31.  Comparison  of  computed  ice  (solid  lines)  and  experimental  ice  (dashed  lines)
         shapes  for  mixed  ice: (a)  wing,  flight  85-24a,  (b)  tail,  flight  84-24a,  (c)  wing,  flight  85-24b,
         (d)  tail,  flight  85-24b,  (e)  wing,  flight  84-34, and  (f)  wing,  flight  84-29.
   41   42   43   44   45   46   47   48   49   50   51