
Page 47 - Computational Fluid Dynamics for Engineers
P. 47
32 1. Introduction
15.0 10.0 15.0
(b)
15.0
(c)
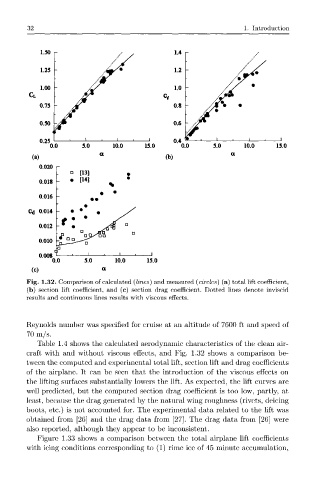
Fig. 1.32. Comparison of calculated (lines) and measured (circles) (a) total lift coefficient,
(b) section lift coefficient, and (c) section drag coefficient. Dotted lines denote inviscid
results and continuous lines results with viscous effects.
Reynolds number was specified for cruise at an altitude of 7600 ft and speed of
70 m/s.
Table 1.4 shows the calculated aerodynamic characteristics of the clean air-
craft with and without viscous effects, and Fig. 1.32 shows a comparison be-
tween the computed and experimental total lift, section lift and drag coefficients
of the airplane. It can be seen that the introduction of the viscous effects on
the lifting surfaces substantially lowers the lift. As expected, the lift curves are
well predicted, but the computed section drag coefficient is too low, partly, at
least, because the drag generated by the natural wing roughness (rivets, deicing
boots, etc.) is not accounted for. The experimental data related to the lift was
obtained from [26] and the drag data from [27]. The drag data from [26] were
also reported, although they appear to be inconsistent.
Figure 1.33 shows a comparison between the total airplane lift coefficients
with icing conditions corresponding to (1) rime ice of 45 minute accumulation,