
Page 44 - Computational Fluid Dynamics for Engineers
P. 44
1.4 Prediction of Aircraft Performance Degradation Due to Icing 29
Table 1.3. Atmospheric Icing Conditions For Twin Otter Tests.
Flight Type Pressure Speed Duration Static Liquid Medium Unit
1
No. of Ice (pa) (ms- ) of temp. (K) water particle length
encounter content diameter roughness
3
(min) (gm- ) (Urn) parameter
85-17 Rime 88150 59.72 65 261.50 0.22 12.4 5.764
83-11 Rime 84000 71.08 45 262.40 0.29 13.0 7.078
85-24a Mixed 79600 71.38 15 258.30 0.45 19.5 7.814
85-24b Mixed 79600 71.94 20 258.70 0.46 15.1 7.813
84-29 Mixed 79600 75.55 49 266.15 0.15 14.6 6.722
84-34 Mixed 82000 70.57 22 266.65 0.58 10.1 12.109
84-27 Glaze 73000 70.57 25 267.95 0.34 15.0 8.708
83-10 Glaze 85500 70.18 26 269.15 0.31 13.0 8.852
to combine viscous effects with an inviscid method, to improve the accuracy of
the flowfield calculations (lift) and calculate the viscous drag. Here an interactive
boundary-layer method developed for clean and iced airfoils [5] is applied to the
lifting surfaces (wing and tail) of the aircraft with a strip-theory approximation
[23]. In this method, the inviscid-flow equations are solved for three-dimensional
flows by the panel method of Hess [4] and the two-dimensional boundary-layer
equations are solved in inverse form with Keller's box method [5].
The icing conditions considered in [23] are given in Table 1.3. The computed
ice shapes for the wing correspond to the section where experimental results
were available, which was at 69% of the wing semi-span. Computed ice shapes
for the tail are shown for 45% of the tail semi-span, though no experimental
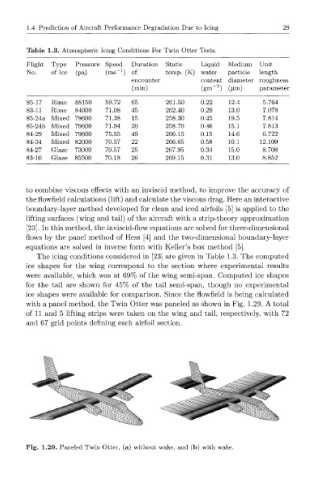
ice shapes were available for comparison. Since the flowfield is being calculated
with a panel method, the Twin Otter was paneled as shown in Fig. 1.29. A total
of 11 and 5 lifting strips were taken on the wing and tail, respectively, with 72
and 67 grid points defining each airfoil section.
Fig. 1.29. Paneled Twin Otter, (a) without wake, and (b) with wake.