Page 48 - Computational Fluid Dynamics for Engineers
P. 48

1.4  Prediction  of  Aircraft  Performance  Degradation  Due  to  Icing  33


            1.2

            1.0

            0.8                                            calc.  : clean
                                                        — calc.  :  all iced
                                                         o exp.  :  all iced
            0.6
                                                         -  calc.  : wings deiced
                                                         •  exp.  : wings  deiced
            0.4

            0.2                      j  .  i
                             4        8   10
          (a)               a

            1.2                                  1.2

            1.0                                  1.0

            0.8                                  0.8


            0.6                                  0.6

            0.4                                  0.4

            0.2        J  i  L       JL          0.2    J  ,  L  _L_       J  .  I
                        2   4    6    8   10       -2   0    2    4   6    8   10
                            a                                     a
          (b)                                   (C)
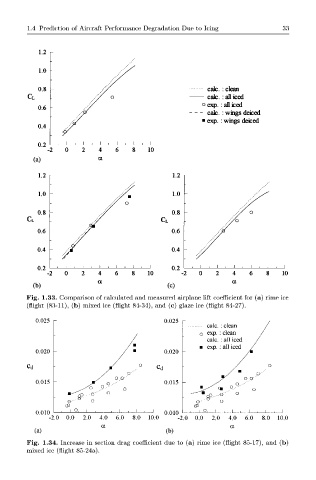
        Fig.  1.33.  Comparison  of calculated  and  measured  airplane  lift  coefficient  for  (a)  rime  ice
         (flight  (83-11),  (b)  mixed  ice  (flight  84-34),  and  (c)  glaze  ice  (flight  84-27).
           0.025                               0.025
                                                           calc.  : clean
                                                         o  exp. : clean
                                                    -
                                                           calc.  : all iced
                                                         •  exp. : all iced
           0.020                               0.020  -
         Cd                                                                 o
                                                                 /  m   O''
                                                             /       o  0''
           0.015                               0.015  —     /      O.--'
                                                         K ^  CM  °-••'  o
                                                    -     & • • • • * ' "  °
           0.010                               0.010   ,  1  O,  |  ,  1  ,  1  1  1  I  1
               -2.0  0.0  2.0  4.0  6.0  8.0  10.0  -2.0  0.0  2.0  4.0  6.0  8.0  10.0
                             a                                   a
           (a)                                 (b)
         Fig.  1.34.  Increase  in  section  drag  coefficient  due  to  (a)  rime  ice  (flight  85-17),  and  (b)
         mixed  ice  (flight  85-24a).
   43   44   45   46   47   48   49   50   51   52   53