
Page 117 - Computational Modeling in Biomedical Engineering and Medical Physics
P. 117
106 Computational Modeling in Biomedical Engineering and Medical Physics
, and other nonspe-
ionic species (sodium, I Na , calcium, I Ca , and potassium, I K1 and I x 1
cific ionic components, I s )(Beeler and Reuter, 1977)
1 I s ;
I ion 5 I Na 1 I K 1 1 I x 1 ð4:12Þ
exp 0:04 V m 185ÞÞ21 exp 0:04 V m 177ÞÞ21
where I K 1 51:4 ð ð , I x 1 50:8x 1 ð ð ,
exp 0:08 V m 153ðð ÞÞ1exp 0:04 V m 153ÞÞ exp 0:04 V m 135ðð ÞÞ
ð
ð
3
2
I Na 5G Na m hV m 2E Na Þ, I s 5G s fd V m 2E s Þ, x 1 is a gating variable, G Na 515 mS/cm is
ð
ð
1
the maximal per unit area conductance of the Na channels, E Na 540 mV is the equilib-
1
2
rium Nernst potential for the Na ions; G s 5 0.09 mS/cm is the maximal membrane per
21
unit area conductance of the Ca channels, E s mV5282:13213:0287 lnc Ca;i the font
½
in the equation seems to be of smaller size is the equilibrium Nernst potential for the Ca 21
ions. The dynamics of the Ca 21 intracellular concentration c Ca , the gating variables m and h
1 21
(for Na channels), f and d (for Ca channels), and x 1 (for potassium channel) are ruled by
dc Ca;i 27 27 da
52 10 I s 1 0:07 10 2 c Ca;i ; 5 a N V m Þ 2 að ð Þ=τ a V m Þ; a 5 fm; h; d; f ; x 1 g;
ð
dt dt
ð4:13Þ
where a N and τ a for the different quantities are found in Beeler and Reuter (1977).
The initial conditions are V m (0) 5285 mV (the resting potential of the cardiac
cell), c Ca,i (0) 5 3 3 10 27 M, m(0) 5 0.01126, h(0) 5 0.9871, d(0) 5 0.003, f(0) 5 1,
x 1 (0) 5 0. The ODEs Eq. (4.13) are solved numerically (Mocanu et al., 2007). The
2
amplitude of the stimulus was twice the diastolic threshold, I stim 5 70 μA/cm , with a
duration of 2 ms (typical value used in experiments), for a 7-cm long cable.
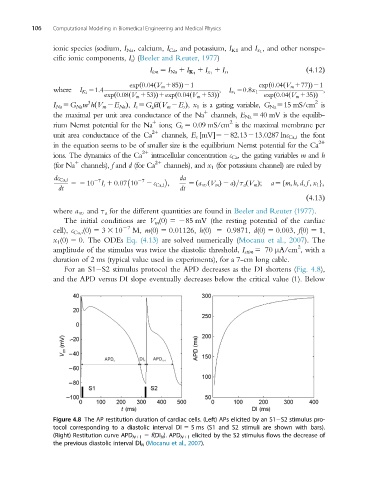
For an S1 S2 stimulus protocol the APD decreases as the DI shortens (Fig. 4.8),
and the APD versus DI slope eventually decreases below the critical value (1). Below
Figure 4.8 The AP restitution duration of cardiac cells. (Left) APs elicited by an S1 S2 stimulus pro-
tocol corresponding to a diastolic interval DI 5 5 ms (S1 and S2 stimuli are shown with bars).
(Right) Restitution curve APD N11 5 f(DI N ). APD N11 elicited by the S2 stimulus flows the decrease of
the previous diastolic interval DI N (Mocanu et al., 2007).