
Page 132 - Computational Retinal Image Analysis
P. 132
4 Graph based methods 125
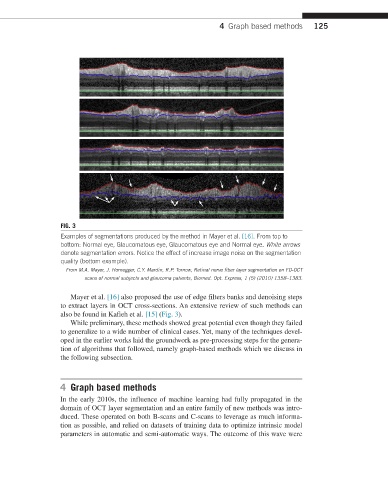
FIG. 3
Examples of segmentations produced by the method in Mayer et al. [16]. From top to
bottom: Normal eye, Glaucomatous eye, Glaucomatous eye and Normal eye. White arrows
denote segmentation errors. Notice the effect of increase image noise on the segmentation
quality (bottom example).
From M.A. Mayer, J. Hornegger, C.Y. Mardin, R.P. Tornow, Retinal nerve fiber layer segmentation on FD-OCT
scans of normal subjects and glaucoma patients, Biomed. Opt. Express, 1 (5) (2010) 1358–1383.
Mayer et al. [16] also proposed the use of edge filters banks and denoising steps
to extract layers in OCT cross-sections. An extensive review of such methods can
also be found in Kafieh et al. [15] (Fig. 3).
While preliminary, these methods showed great potential even though they failed
to generalize to a wide number of clinical cases. Yet, many of the techniques devel-
oped in the earlier works laid the groundwork as pre-processing steps for the genera-
tion of algorithms that followed, namely graph-based methods which we discuss in
the following subsection.
4 Graph based methods
In the early 2010s, the influence of machine learning had fully propagated in the
domain of OCT layer segmentation and an entire family of new methods was intro-
duced. These operated on both B-scans and C-scans to leverage as much informa-
tion as possible, and relied on datasets of training data to optimize intrinsic model
parameters in automatic and semi-automatic ways. The outcome of this wave were