
Page 133 - Computational Retinal Image Analysis
P. 133
126 CHAPTER 7 OCT layer segmentation
automated methods that strongly outperformed earlier approaches, and in particular,
showed a much better capability to generalize to more complex pathological cases.
Based on discrete optimization methods of energy functions in image domains,
the core of these methods involved reformulating the OCT layer segmentation prob-
lem as a graph-based optimization problem. In practice, this involved defining an
energy function that contained a unary term that modeled pixel wise evidence of
boundaries, as well as a pairwise term that enforced spatial regularization. Based
on the seminal work of Boykov et al. [17] and with some conditions, such functions
could be solved optimally extremely efficiently.
Using these results and building on them, the work of Garvin et al. [18] intro-
duced the “Iowa Reference Algorithms” as one of the earlier graph-based methods.
Available online for free, this method used unary terms derived from filter responses
and multiple constraints from the different retinal layers to segment seven differ-
ent layers. Similarly Lang et al. [18a] also used a graph-cut based solution to infer
nine segmentation layers, but augmented the complexity of the method by using a
Random Forest classifier to compute the unary terms of the energy function. At the
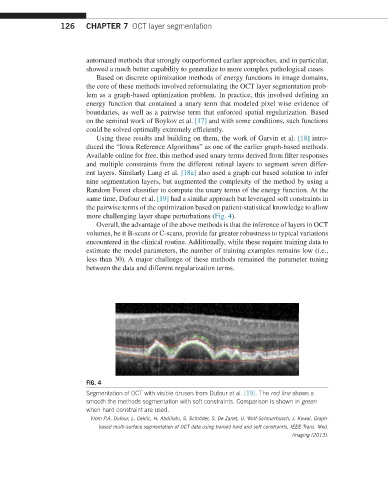
same time, Dufour et al. [19] had a similar approach but leveraged soft constraints in
the pairwise terms of the optimization based on patient-statistical knowledge to allow
more challenging layer shape perturbations (Fig. 4).
Overall, the advantage of the above methods is that the inference of layers in OCT
volumes, be it B-scans or C-scans, provide far greater robustness to typical variations
encountered in the clinical routine. Additionally, while these require training data to
estimate the model parameters, the number of training examples remains low (i.e.,
less than 30). A major challenge of these methods remained the parameter tuning
between the data and different regularization terms.
FIG. 4
Segmentation of OCT with visible drusen from Dufour et al. [19]. The red line shows a
smooth the methods segmentation with soft constraints. Comparison is shown in green
when hard constraint are used.
From P.A. Dufour, L. Ceklic, H. Abdillahi, S. Schröder, S. De Zanet, U. Wolf-Schnurrbusch, J. Kowal, Graph-
based multi-surface segmentation of OCT data using trained hard and soft constraints, IEEE Trans. Med.
Imaging (2013).