
Page 239 - Computational Retinal Image Analysis
P. 239
236 CHAPTER 12 Diabetic retinopathy and maculopathy lesions
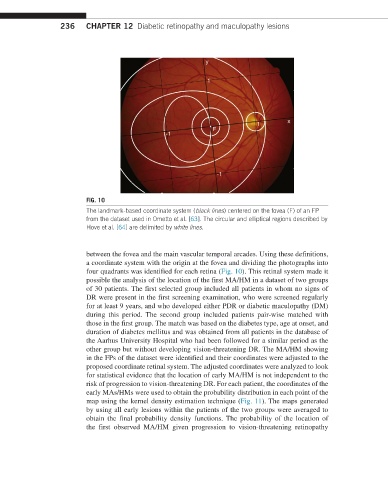
FIG. 10
The landmark-based coordinate system (black lines) centered on the fovea (F) of an FP
from the dataset used in Ometto et al. [63]. The circular and elliptical regions described by
Hove et al. [64] are delimited by white lines.
between the fovea and the main vascular temporal arcades. Using these definitions,
a coordinate system with the origin at the fovea and dividing the photographs into
four quadrants was identified for each retina (Fig. 10). This retinal system made it
possible the analysis of the location of the first MA/HM in a dataset of two groups
of 30 patients. The first selected group included all patients in whom no signs of
DR were present in the first screening examination, who were screened regularly
for at least 9 years, and who developed either PDR or diabetic maculopathy (DM)
during this period. The second group included patients pair-wise matched with
those in the first group. The match was based on the diabetes type, age at onset, and
duration of diabetes mellitus and was obtained from all patients in the database of
the Aarhus University Hospital who had been followed for a similar period as the
other group but without developing vision-threatening DR. The MA/HM showing
in the FPs of the dataset were identified and their coordinates were adjusted to the
proposed coordinate retinal system. The adjusted coordinates were analyzed to look
for statistical evidence that the location of early MA/HM is not independent to the
risk of progression to vision-threatening DR. For each patient, the coordinates of the
early MAs/HMs were used to obtain the probability distribution in each point of the
map using the kernel density estimation technique (Fig. 11). The maps generated
by using all early lesions within the patients of the two groups were averaged to
obtain the final probability density functions. The probability of the location of
the first observed MA/HM given progression to vision-threatening retinopathy