
Page 240 - Computational Retinal Image Analysis
P. 240
5 Lesion localization 237
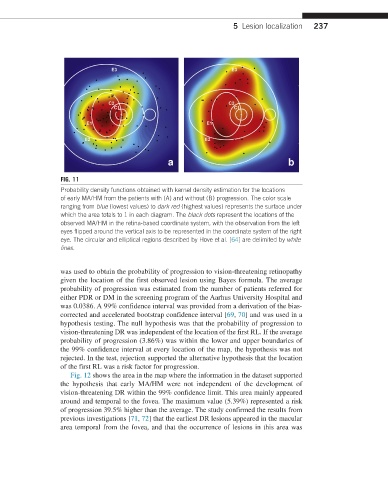
FIG. 11
Probability density functions obtained with kernel density estimation for the locations
of early MA/HM from the patients with (A) and without (B) progression. The color scale
ranging from blue (lowest values) to dark red (highest values) represents the surface under
which the area totals to 1 in each diagram. The black dots represent the locations of the
observed MA/HM in the retina-based coordinate system, with the observation from the left
eyes flipped around the vertical axis to be represented in the coordinate system of the right
eye. The circular and elliptical regions described by Hove et al. [64] are delimited by white
lines.
was used to obtain the probability of progression to vision-threatening retinopathy
given the location of the first observed lesion using Bayes formula. The average
probability of progression was estimated from the number of patients referred for
either PDR or DM in the screening program of the Aarhus University Hospital and
was 0.0386. A 99% confidence interval was provided from a derivation of the bias-
corrected and accelerated bootstrap confidence interval [69, 70] and was used in a
hypothesis testing. The null hypothesis was that the probability of progression to
vision-threatening DR was independent of the location of the first RL. If the average
probability of progression (3.86%) was within the lower and upper boundaries of
the 99% confidence interval at every location of the map, the hypothesis was not
rejected. In the test, rejection supported the alternative hypothesis that the location
of the first RL was a risk factor for progression.
Fig. 12 shows the area in the map where the information in the dataset supported
the hypothesis that early MA/HM were not independent of the development of
vision-threatening DR within the 99% confidence limit. This area mainly appeared
around and temporal to the fovea. The maximum value (5.39%) represented a risk
of progression 39.5% higher than the average. The study confirmed the results from
previous investigations [71, 72] that the earliest DR lesions appeared in the macular
area temporal from the fovea, and that the occurrence of lesions in this area was