
Page 241 - Computational Retinal Image Analysis
P. 241
238 CHAPTER 12 Diabetic retinopathy and maculopathy lesions
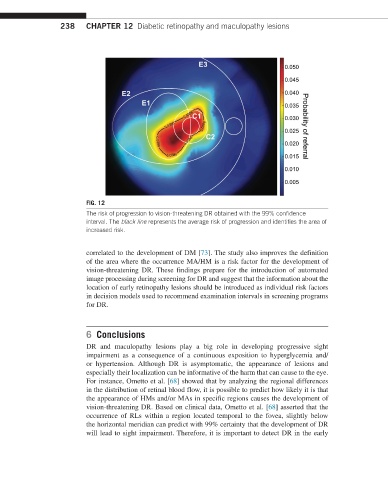
FIG. 12
The risk of progression to vision-threatening DR obtained with the 99% confidence
interval. The black line represents the average risk of progression and identifies the area of
increased risk.
correlated to the development of DM [73]. The study also improves the definition
of the area where the occurrence MA/HM is a risk factor for the development of
vision-threatening DR. These findings prepare for the introduction of automated
image processing during screening for DR and suggest that the information about the
location of early retinopathy lesions should be introduced as individual risk factors
in decision models used to recommend examination intervals in screening programs
for DR.
6 Conclusions
DR and maculopathy lesions play a big role in developing progressive sight
impairment as a consequence of a continuous exposition to hyperglycemia and/
or hypertension. Although DR is asymptomatic, the appearance of lesions and
especially their localization can be informative of the harm that can cause to the eye.
For instance, Ometto et al. [68] showed that by analyzing the regional differences
in the distribution of retinal blood flow, it is possible to predict how likely it is that
the appearance of HMs and/or MAs in specific regions causes the development of
vision-threatening DR. Based on clinical data, Ometto et al. [68] asserted that the
occurrence of RLs within a region located temporal to the fovea, slightly below
the horizontal meridian can predict with 99% certainty that the development of DR
will lead to sight impairment. Therefore, it is important to detect DR in the early