
Page 237 - Computational Retinal Image Analysis
P. 237
234 CHAPTER 12 Diabetic retinopathy and maculopathy lesions
bands of wavelet transformed images. A genetic algorithm was used to find the
optimal wavelet. Köse et al. [55] combined inverse segmentation method with
Naive Bayes classifier to detect both BL and RL. Figueiredo et al. [56] extracted
a number of multiscale features based on Hessian analysis and wavelet transform.
Subsequently, they devised a number of lesion-specialized binary classifiers to
find all DR lesions.
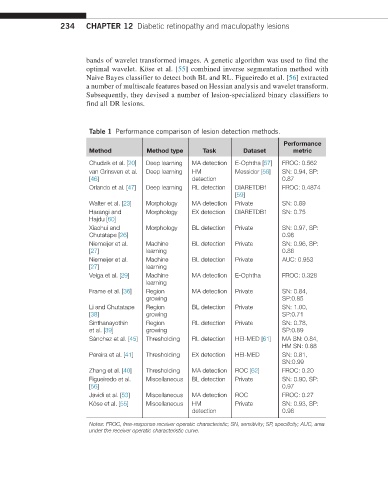
Table 1 Performance comparison of lesion detection methods.
Performance
Method Method type Task Dataset metric
Chudzik et al. [20] Deep learning MA detection E-Ophtha [57] FROC: 0.562
van Grinsven et al. Deep learning HM Messidor [58] SN: 0.94, SP:
[46] detection 0.87
Orlando et al. [47] Deep learning RL detection DIARETDB1 FROC: 0.4874
[59]
Walter et al. [23] Morphology MA detection Private SN: 0.89
Harangi and Morphology EX detection DIARETDB1 SN: 0.75
Hajdu [60]
Xiaohui and Morphology BL detection Private SN: 0.97, SP:
Chutatape [26] 0.96
Niemeijer et al. Machine BL detection Private SN: 0.96, SP:
[27] learning 0.86
Niemeijer et al. Machine BL detection Private AUC: 0.953
[27] learning
Veiga et al. [29] Machine MA detection E-Ophtha FROC: 0.328
learning
Frame et al. [36] Region MA detection Private SN: 0.84,
growing SP:0.85
Li and Chutatape Region BL detection Private SN: 1.00,
[38] growing SP:0.71
Sinthanayothin Region RL detection Private SN: 0.78,
et al. [39] growing SP:0.89
Sánchez et al. [45] Thresholding RL detection HEI-MED [61] MA SN: 0.84,
HM SN: 0.88
Pereira et al. [41] Thresholding EX detection HEI-MED SN: 0.81,
SN:0.99
Zhang et al. [40] Thresholding MA detection ROC [62] FROC: 0.20
Figueiredo et al. Miscellaneous BL detection Private SN: 0.90, SP:
[56] 0.97
Javidi et al. [53] Miscellaneous MA detection ROC FROC: 0.27
Köse et al. [55] Miscellaneous HM Private SN: 0.93, SP:
detection 0.98
Notes: FROC, free-response receiver operatic characteristic; SN, sensitivity; SP, specificity; AUC, area
under the receiver operatic characteristic curve.