
Page 109 - Computational Statistics Handbook with MATLAB
P. 109
96 Computational Statistics Handbook with MATLAB
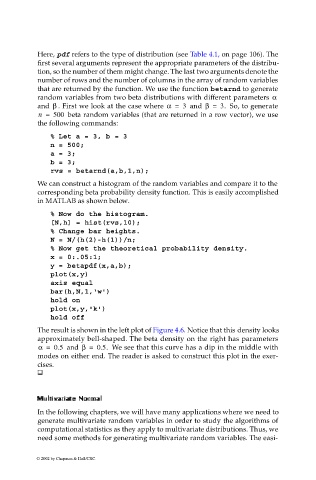
Here, pdf refers to the type of distribution (see Table 4.1, on page 106). The
first several arguments represent the appropriate parameters of the distribu-
tion, so the number of them might change. The last two arguments denote the
number of rows and the number of columns in the array of random variables
that are returned by the function. We use the function betarnd to generate
random variables from two beta distributions with different parameters α
β
and . First we look at the case where α = 3 and β = 3. So, to generate
n = 500 beta random variables (that are returned in a row vector), we use
the following commands:
% Let a = 3, b = 3
n = 500;
a = 3;
b = 3;
rvs = betarnd(a,b,1,n);
We can construct a histogram of the random variables and compare it to the
corresponding beta probability density function. This is easily accomplished
in MATLAB as shown below.
% Now do the histogram.
[N,h] = hist(rvs,10);
% Change bar heights.
N = N/(h(2)-h(1))/n;
% Now get the theoretical probability density.
x = 0:.05:1;
y = betapdf(x,a,b);
plot(x,y)
axis equal
bar(h,N,1,'w')
hold on
plot(x,y,'k')
hold off
The result is shown in the left plot of Figure 4.6. Notice that this density looks
approximately bell-shaped. The beta density on the right has parameters
α = 0.5 and β = 0.5. We see that this curve has a dip in the middle with
modes on either end. The reader is asked to construct this plot in the exer-
cises.
o
ii
ee
NoNo
rr mama
rmma
r
ii
Mult MultMult Multi ivvar vvarar ar i iaat aatt teeNNo a l l ll
In the following chapters, we will have many applications where we need to
generate multivariate random variables in order to study the algorithms of
computational statistics as they apply to multivariate distributions. Thus, we
need some methods for generating multivariate random variables. The easi-
© 2002 by Chapman & Hall/CRC