
Page 112 - Computational Statistics Handbook with MATLAB
P. 112
Chapter 4: Generating Random Variables 99
1.0000 0.6957
0.6957 1.0000
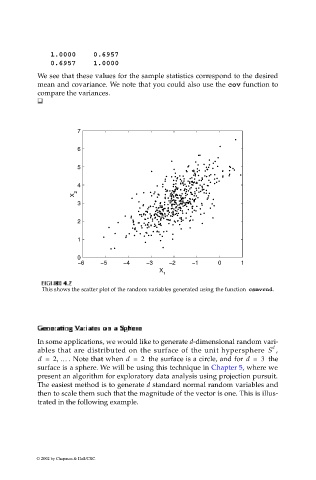
We see that these values for the sample statistics correspond to the desired
mean and covariance. We note that you could also use the cov function to
compare the variances.
7
6
5
4
X 2
3
2
1
0
−6 −5 −4 −3 −2 −1 0 1
X
1
IG
FI F U URE G 4. RE 4. 7 7
F F II GU RE RE 4. 4. 7
7
GU
This shows the scatter plot of the random variables generated using the function csmvrnd.
ee
GeneratingneratingV
GGeeneratingnerating
so
Ge Va ar riateiate s n onon aSaS phere e
VVaarr iateiate
aSpher
ss
pherpher
onaS
In some applications, we would like to generate d-dimensional random vari-
d
ables that are distributed on the surface of the unit hypersphere S ,
,
d = 2 … . Note that when d = 2 the surface is a circle, and for d = 3 the
surface is a sphere. We will be using this technique in Chapter 5, where we
present an algorithm for exploratory data analysis using projection pursuit.
The easiest method is to generate d standard normal random variables and
then to scale them such that the magnitude of the vector is one. This is illus-
trated in the following example.
© 2002 by Chapman & Hall/CRC