
Page 128 - Computational Statistics Handbook with MATLAB
P. 128
Chapter 5: Exploratory Data Analysis 115
Relative Frequency Histogram and Density Estimate
0.35
0.3
0.25
0.2
0.15
0.1
0.05
0
16 17 18 19 20 21 22
Length (inches)
G
2
2
GU
F F FI F II IG URE GU 5. RE RE RE 5. 5. 5. 2 2
U
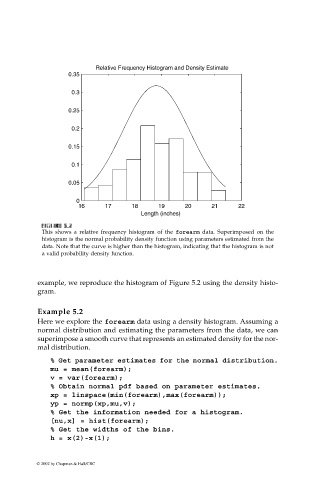
This shows a relative frequency histogram of the forearm data. Superimposed on the
histogram is the normal probability density function using parameters estimated from the
data. Note that the curve is higher than the histogram, indicating that the histogram is not
a valid probability density function.
example, we reproduce the histogram of Figure 5.2 using the density histo-
gram.
Example 5.2
Here we explore the forearm data using a density histogram. Assuming a
normal distribution and estimating the parameters from the data, we can
superimpose a smooth curve that represents an estimated density for the nor-
mal distribution.
% Get parameter estimates for the normal distribution.
mu = mean(forearm);
v = var(forearm);
% Obtain normal pdf based on parameter estimates.
xp = linspace(min(forearm),max(forearm));
yp = normp(xp,mu,v);
% Get the information needed for a histogram.
[nu,x] = hist(forearm);
% Get the widths of the bins.
h = x(2)-x(1);
© 2002 by Chapman & Hall/CRC