
Page 131 - Computational Statistics Handbook with MATLAB
P. 131
118 Computational Statistics Handbook with MATLAB
Height (mm) of Tibetan Skulls
6 2 3 5 5 6 8 9
7 0 0 1 1 1 2 2 3 4 4 4 4 5 6 6 7 7 7 8 9 9
8 0 1 2 3
G
II
GU
4
4
IG
F FI F F U URE GU 5. RE RE RE 5. 5. 5. 4 4
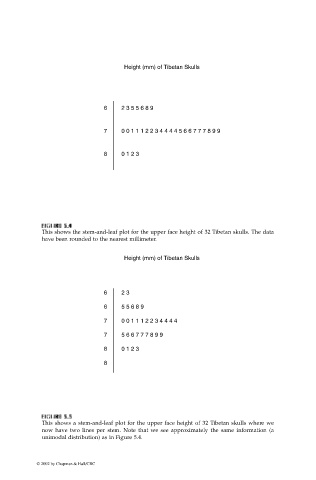
This shows the stem-and-leaf plot for the upper face height of 32 Tibetan skulls. The data
have been rounded to the nearest millimeter.
Height (mm) of Tibetan Skulls
6 2 3
6 5 5 6 8 9
7 0 0 1 1 1 2 2 3 4 4 4 4
7 5 6 6 7 7 7 8 9 9
8 0 1 2 3
8
FI F IG URE G 5. RE 5. 5 5
U
GU
F F II GU RE RE 5. 5. 5
5
This shows a stem-and-leaf plot for the upper face height of 32 Tibetan skulls where we
now have two lines per stem. Note that we see approximately the same information (a
unimodal distribution) as in Figure 5.4.
© 2002 by Chapman & Hall/CRC