
Page 47 - Computational Statistics Handbook with MATLAB
P. 47
Chapter 2: Probability Concepts 33
% Set up the parameters for the normal distribution.
mu = 5;
sigma = 2;
% Set up the upper and lower limits. These are in
% the two element vector 'specs'.
specs = [2, 8];
prob = normspec(specs, mu, sigma);
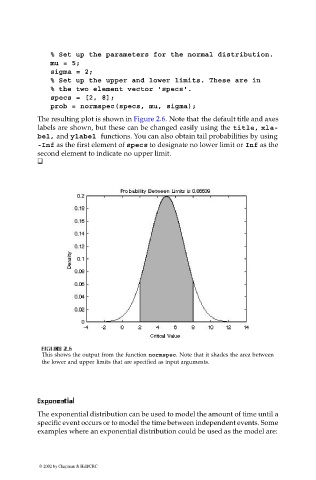
The resulting plot is shown in Figure 2.6. Note that the default title and axes
labels are shown, but these can be changed easily using the title, xla-
bel, and ylabel functions. You can also obtain tail probabilities by using
-Inf as the first element of specs to designate no lower limit or Inf as the
second element to indicate no upper limit.
IG
FI F U URE G 2. RE 2. 6 6
GU
F F II GU RE RE 2. 2. 6
6
This shows the output from the function normspec. Note that it shades the area between
the lower and upper limits that are specified as input arguments.
Expon
EExponxpon
Expon e ent eentnt nti ii iaal aall l
The exponential distribution can be used to model the amount of time until a
specific event occurs or to model the time between independent events. Some
examples where an exponential distribution could be used as the model are:
© 2002 by Chapman & Hall/CRC