
Page 329 -
P. 329
Section 10.3 Fitting Curved Structures 297
some subset of the data points. The best solution for lines and data points is
obtained by minimizing
2
dist(l i ,x j )
l i ∈lines x j ∈data due to ith line
over both correspondences and lines. Again, there are too many correspondences
to search this space.
It is easy to modify k-means to deal with this problem. The two phases are
as follows:
• Allocate each point to the closest line.
• Fit the best line to the points allocated to each line.
This results in Algorithm 10.2. Convergence can be tested by looking at the size
of the change in the lines, at whether labels have been flipped (probably the best
test), or at the sum of perpendicular distances of points from their lines.
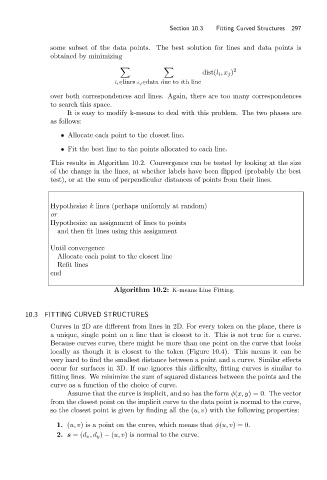
Hypothesize k lines (perhaps uniformly at random)
or
Hypothesize an assignment of lines to points
and then fit lines using this assignment
Until convergence
Allocate each point to the closest line
Refit lines
end
Algorithm 10.2: K-means Line Fitting.
10.3 FITTING CURVED STRUCTURES
Curves in 2D are different from lines in 2D. For every token on the plane, there is
a unique, single point on a line that is closest to it. This is not true for a curve.
Because curves curve, there might be more than one point on the curve that looks
locally as though it is closest to the token (Figure 10.4). This means it can be
very hard to find the smallest distance between a point and a curve. Similar effects
occur for surfaces in 3D. If one ignores this difficulty, fitting curves is similar to
fitting lines. We minimize the sum of squared distances between the points and the
curve as a function of the choice of curve.
Assume that the curve is implicit, and so has the form φ(x, y) = 0. The vector
from the closest point on the implicit curve to the data point is normal to the curve,
so the closest point is given by finding all the (u, v) with the following properties:
1. (u, v) is a point on the curve, which means that φ(u, v)= 0.
2. s =(d x ,d y ) − (u, v) is normal to the curve.