
Page 224 -
P. 224
4.1 Points and patches 203
D A
d 2
d 1 d ’ D D
1
D C d ’
2
D B
D E
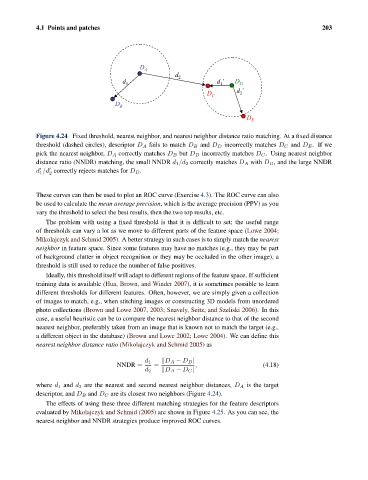
Figure 4.24 Fixed threshold, nearest neighbor, and nearest neighbor distance ratio matching. At a fixed distance
threshold (dashed circles), descriptor D A fails to match D B and D D incorrectly matches D C and D E .If we
pick the nearest neighbor, D A correctly matches D B but D D incorrectly matches D C . Using nearest neighbor
distance ratio (NNDR) matching, the small NNDR d 1 /d 2 correctly matches D A with D B , and the large NNDR
d /d correctly rejects matches for D D .
1 2
These curves can then be used to plot an ROC curve (Exercise 4.3). The ROC curve can also
be used to calculate the mean average precision, which is the average precision (PPV) as you
vary the threshold to select the best results, then the two top results, etc.
The problem with using a fixed threshold is that it is difficult to set; the useful range
of thresholds can vary a lot as we move to different parts of the feature space (Lowe 2004;
Mikolajczyk and Schmid 2005). A better strategy in such cases is to simply match the nearest
neighbor in feature space. Since some features may have no matches (e.g., they may be part
of background clutter in object recognition or they may be occluded in the other image), a
threshold is still used to reduce the number of false positives.
Ideally, this threshold itself will adapt to different regions of the feature space. If sufficient
training data is available (Hua, Brown, and Winder 2007), it is sometimes possible to learn
different thresholds for different features. Often, however, we are simply given a collection
of images to match, e.g., when stitching images or constructing 3D models from unordered
photo collections (Brown and Lowe 2007, 2003; Snavely, Seitz, and Szeliski 2006). In this
case, a useful heuristic can be to compare the nearest neighbor distance to that of the second
nearest neighbor, preferably taken from an image that is known not to match the target (e.g.,
a different object in the database) (Brown and Lowe 2002; Lowe 2004). We can define this
nearest neighbor distance ratio (Mikolajczyk and Schmid 2005)as
d 1 D A − D B |
NNDR = = , (4.18)
d 2 D A − D C |
where d 1 and d 2 are the nearest and second nearest neighbor distances, D A is the target
descriptor, and D B and D C are its closest two neighbors (Figure 4.24).
The effects of using these three different matching strategies for the feature descriptors
evaluated by Mikolajczyk and Schmid (2005) are shown in Figure 4.25. As you can see, the
nearest neighbor and NNDR strategies produce improved ROC curves.