
Page 222 -
P. 222
4.1 Points and patches 201
1 4
1
1 3 2
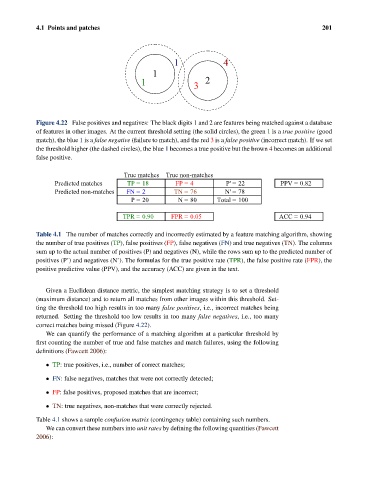
Figure 4.22 False positives and negatives: The black digits 1 and 2 are features being matched against a database
of features in other images. At the current threshold setting (the solid circles), the green 1 is a true positive (good
match), the blue 1 is a false negative (failure to match), and the red 3 is a false positive (incorrect match). If we set
the threshold higher (the dashed circles), the blue 1 becomes a true positive but the brown 4 becomes an additional
false positive.
True matches True non-matches
Predicted matches TP = 18 FP = 4 P' = 22 PPV = 0.82
Predicted non-matches FN = 2 TN = 76 N' = 78
P = 20 N = 80 Total = 100
TPR = 0.90 FPR = 0.05 ACC = 0.94
Table 4.1 The number of matches correctly and incorrectly estimated by a feature matching algorithm, showing
the number of true positives (TP), false positives (FP), false negatives (FN) and true negatives (TN). The columns
sum up to the actual number of positives (P) and negatives (N), while the rows sum up to the predicted number of
positives (P’) and negatives (N’). The formulas for the true positive rate (TPR), the false positive rate (FPR), the
positive predictive value (PPV), and the accuracy (ACC) are given in the text.
Given a Euclidean distance metric, the simplest matching strategy is to set a threshold
(maximum distance) and to return all matches from other images within this threshold. Set-
ting the threshold too high results in too many false positives, i.e., incorrect matches being
returned. Setting the threshold too low results in too many false negatives, i.e., too many
correct matches being missed (Figure 4.22).
We can quantify the performance of a matching algorithm at a particular threshold by
first counting the number of true and false matches and match failures, using the following
definitions (Fawcett 2006):
• TP: true positives, i.e., number of correct matches;
• FN: false negatives, matches that were not correctly detected;
• FP: false positives, proposed matches that are incorrect;
• TN: true negatives, non-matches that were correctly rejected.
Table 4.1 shows a sample confusion matrix (contingency table) containing such numbers.
We can convert these numbers into unit rates by defining the following quantities (Fawcett
2006):