
Page 223 -
P. 223
202 4 Feature detection and matching
1
equal error
true positive rate random chance #
rate
0.8
TP TN
0 0.1 1 FP FN
false positive rate ș d
(a) (b)
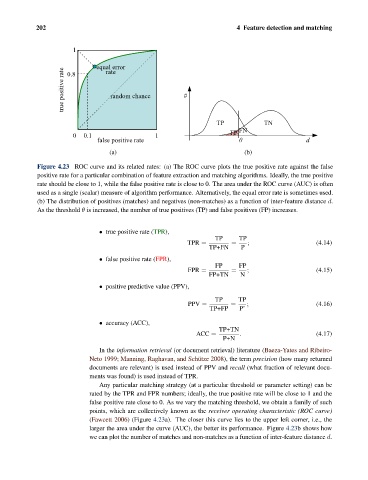
Figure 4.23 ROC curve and its related rates: (a) The ROC curve plots the true positive rate against the false
positive rate for a particular combination of feature extraction and matching algorithms. Ideally, the true positive
rate should be close to 1, while the false positive rate is close to 0. The area under the ROC curve (AUC) is often
used as a single (scalar) measure of algorithm performance. Alternatively, the equal error rate is sometimes used.
(b) The distribution of positives (matches) and negatives (non-matches) as a function of inter-feature distance d.
As the threshold θ is increased, the number of true positives (TP) and false positives (FP) increases.
• true positive rate (TPR),
TP TP
TPR = = ; (4.14)
TP+FN P
• false positive rate (FPR),
FP FP
FPR = = ; (4.15)
FP+TN N
• positive predictive value (PPV),
TP TP
PPV = = ; (4.16)
TP+FP P’
• accuracy (ACC),
TP+TN
ACC = . (4.17)
P+N
In the information retrieval (or document retrieval) literature (Baeza-Yates and Ribeiro-
Neto 1999; Manning, Raghavan, and Sch¨ utze 2008), the term precision (how many returned
documents are relevant) is used instead of PPV and recall (what fraction of relevant docu-
ments was found) is used instead of TPR.
Any particular matching strategy (at a particular threshold or parameter setting) can be
rated by the TPR and FPR numbers; ideally, the true positive rate will be close to 1 and the
false positive rate close to 0. As we vary the matching threshold, we obtain a family of such
points, which are collectively known as the receiver operating characteristic (ROC curve)
(Fawcett 2006) (Figure 4.23a). The closer this curve lies to the upper left corner, i.e., the
larger the area under the curve (AUC), the better its performance. Figure 4.23b shows how
we can plot the number of matches and non-matches as a function of inter-feature distance d.