
Page 225 -
P. 225
204 4 Feature detection and matching
1
gloh cross correlation
0.9
sift gradient moments
pca −sift complex filters
0.8
shape context differential invariants
spin steerable filters
0.7
hes−lap gloh
#correct / 3708 0.5
0.6
0.4
0.3
0.2
0.1
0
0 0.1 0.2 0.3 0.4 0.5 0.6 0.7 0.8 0.9 1
1−precision
(a)
1 1
gloh cross correlation gloh cross correlation
0.9 gradient moments 0.9 sift gradient moments
sift
pca −sift complex filters pca −sift complex filters
0.8 0.8
shape context differential invariants shape context differential invariants
0.7 spin steerable filters 0.7 spin steerable filters
hes−lap gloh 0.6 hes−lap gloh
#correct / 926 0.5 #correct / 926 0.5
0.6
0.4
0.3
0.3 0.4
0.2 0.2
0.1 0.1
0 0
0 0.1 0.2 0.3 0.4 0.5 0.6 0.7 0.8 0.9 1 0 0.1 0.2 0.3 0.4 0.5 0.6 0.7 0.8 0.9 1
1−precision 1−precision
(b) (c)
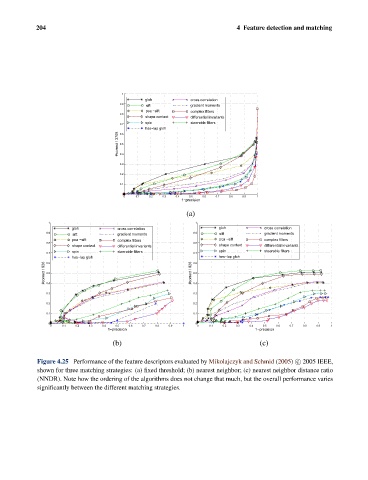
Figure 4.25 Performance of the feature descriptors evaluated by Mikolajczyk and Schmid (2005) c 2005 IEEE,
shown for three matching strategies: (a) fixed threshold; (b) nearest neighbor; (c) nearest neighbor distance ratio
(NNDR). Note how the ordering of the algorithms does not change that much, but the overall performance varies
significantly between the different matching strategies.