
Page 286 -
P. 286
5.5 Graph cuts and energy-based methods 265
Background Background
T terminal T terminal
cut
p q r p q r
w v w v
Object S Object S
terminal terminal
(a) (b)
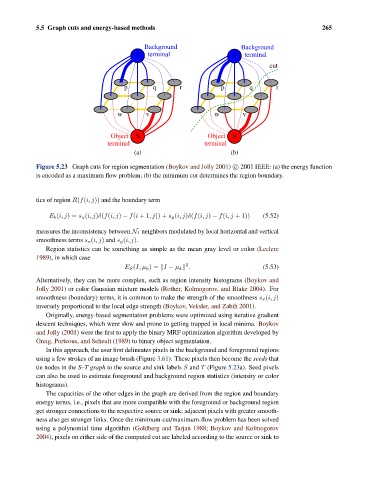
Figure 5.23 Graph cuts for region segmentation (Boykov and Jolly 2001) c 2001 IEEE: (a) the energy function
is encoded as a maximum flow problem; (b) the minimum cut determines the region boundary.
tics of region R(f(i, j)) and the boundary term
E b (i, j)= s x (i, j)δ(f(i, j) − f(i +1,j)) + s y (i, j)δ(f(i, j) − f(i, j + 1)) (5.52)
measures the inconsistency between N 4 neighbors modulated by local horizontal and vertical
smoothness terms s x (i, j) and s y (i, j).
Region statistics can be something as simple as the mean gray level or color (Leclerc
1989), in which case
2
E S (I; μ k )= I − μ k . (5.53)
Alternatively, they can be more complex, such as region intensity histograms (Boykov and
Jolly 2001) or color Gaussian mixture models (Rother, Kolmogorov, and Blake 2004). For
smoothness (boundary) terms, it is common to make the strength of the smoothness s x (i, j)
inversely proportional to the local edge strength (Boykov, Veksler, and Zabih 2001).
Originally, energy-based segmentation problems were optimized using iterative gradient
descent techniques, which were slow and prone to getting trapped in local minima. Boykov
and Jolly (2001) were the first to apply the binary MRF optimization algorithm developed by
Greig, Porteous, and Seheult (1989) to binary object segmentation.
In this approach, the user first delineates pixels in the background and foreground regions
using a few strokes of an image brush (Figure 3.61). These pixels then become the seeds that
tie nodes in the S–T graph to the source and sink labels S and T (Figure 5.23a). Seed pixels
can also be used to estimate foreground and background region statistics (intensity or color
histograms).
The capacities of the other edges in the graph are derived from the region and boundary
energy terms, i.e., pixels that are more compatible with the foreground or background region
get stronger connections to the respective source or sink; adjacent pixels with greater smooth-
ness also get stronger links. Once the minimum-cut/maximum-flow problem has been solved
using a polynomial time algorithm (Goldberg and Tarjan 1988; Boykov and Kolmogorov
2004), pixels on either side of the computed cut are labeled according to the source or sink to