
Page 284 -
P. 284
5.4 Normalized cuts 263
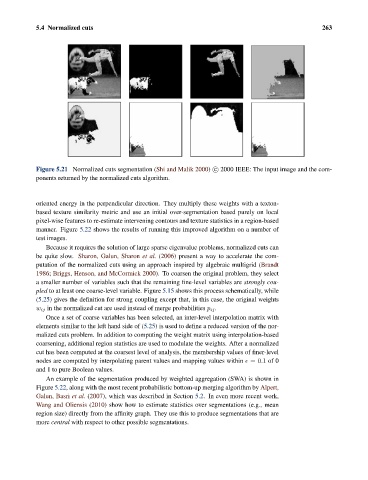
Figure 5.21 Normalized cuts segmentation (Shi and Malik 2000) c 2000 IEEE: The input image and the com-
ponents returned by the normalized cuts algorithm.
oriented energy in the perpendicular direction. They multiply these weights with a texton-
based texture similarity metric and use an initial over-segmentation based purely on local
pixel-wise features to re-estimate intervening contours and texture statistics in a region-based
manner. Figure 5.22 shows the results of running this improved algorithm on a number of
test images.
Because it requires the solution of large sparse eigenvalue problems, normalized cuts can
be quite slow. Sharon, Galun, Sharon et al. (2006) present a way to accelerate the com-
putation of the normalized cuts using an approach inspired by algebraic multigrid (Brandt
1986; Briggs, Henson, and McCormick 2000). To coarsen the original problem, they select
a smaller number of variables such that the remaining fine-level variables are strongly cou-
pled to at least one coarse-level variable. Figure 5.15 shows this process schematically, while
(5.25) gives the definition for strong coupling except that, in this case, the original weights
w ij in the normalized cut are used instead of merge probabilities p ij .
Once a set of coarse variables has been selected, an inter-level interpolation matrix with
elements similar to the left hand side of (5.25) is used to define a reduced version of the nor-
malized cuts problem. In addition to computing the weight matrix using interpolation-based
coarsening, additional region statistics are used to modulate the weights. After a normalized
cut has been computed at the coarsest level of analysis, the membership values of finer-level
nodes are computed by interpolating parent values and mapping values within =0.1 of 0
and 1 to pure Boolean values.
An example of the segmentation produced by weighted aggregation (SWA) is shown in
Figure 5.22, along with the most recent probabilistic bottom-up merging algorithm by Alpert,
Galun, Basri et al. (2007), which was described in Section 5.2. In even more recent work,
Wang and Oliensis (2010) show how to estimate statistics over segmentations (e.g., mean
region size) directly from the affinity graph. They use this to produce segmentations that are
more central with respect to other possible segmentations.