
Page 124 - Corrosion Engineering Principles and Practice
P. 124
98 C h a p t e r 5 C o r r o s i o n K i n e t i c s a n d A p p l i c a t i o n s o f E l e c t r o c h e m i s t r y 99
An alternating current from the soil resistance meter causes
current to flow through the soil, between pins C1 and C2 and the
voltage or potential is measured between pins P1 and P2. Resistivity
of the soil is then computed from the instrument reading, according
to the following formula [1]:
r = 2π aR (5.18)
where r is the soil resistivity (Ω cm)
a is the distance between probes (cm)
R is the soil resistance (Ω), instrument reading
p is 3.1416
The resistivity values obtained represent the average resistivity of
the soil to a depth equal to the pin spacing. Resistance measurements
are typically performed to a depth equal to that of the buried system
(pipeline) being evaluated. Typical probe spacing is in increments of
0.5 to 1 m.
If the line of soil pins used when making four-pin resistivity
measurements is closely parallel to a bare underground pipeline or
other metallic structure, the presence of the bare metal may cause the
indicated soil resistivity values to be lower than it actually is. Because
a portion of the test current will flow along the metallic structure
rather than through the soil, measurements along a line closely
parallel to pipelines should therefore be avoided.
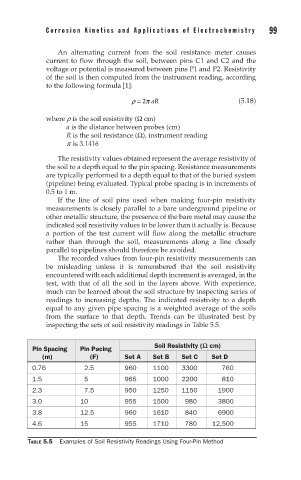
The recorded values from four-pin resistivity measurements can
be misleading unless it is remembered that the soil resistivity
encountered with each additional depth increment is averaged, in the
test, with that of all the soil in the layers above. With experience,
much can be learned about the soil structure by inspecting series of
readings to increasing depths. The indicated resistivity to a depth
equal to any given pipe spacing is a weighted average of the soils
from the surface to that depth. Trends can be illustrated best by
inspecting the sets of soil resistivity readings in Table 5.5.
Soil Resistivity (W cm)
Pin Spacing Pin Pacing
(m) (F) Set A Set B Set C Set D
0.76 2.5 960 1100 3300 760
1.5 5 965 1000 2200 810
2.3 7.5 950 1250 1150 1900
3.0 10 955 1500 980 3800
3.8 12.5 960 1610 840 6900
4.6 15 955 1710 780 12,500
TABLE 5.5 Examples of Soil Resistivity Readings Using Four-Pin Method