
Page 129 - Corrosion Engineering Principles and Practice
P. 129
104 C h a p t e r 5 C o r r o s i o n K i n e t i c s a n d A p p l i c a t i o n s o f E l e c t r o c h e m i s t r y 105
0
2+
Fe → Fe + 2e –
–0.1
E corr & I corr
Potential (V vs. SHE) –0.2
–0.3
+ –
2H + 2e → H 2
–0.4
–5.5 –5 –4.5 –4 –3.5 –3 –2.5 –2
Log (|i|(A))
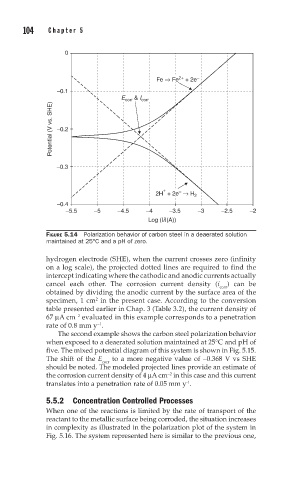
FIGURE 5.14 Polarization behavior of carbon steel in a deaerated solution
maintained at 25°C and a pH of zero.
hydrogen electrode (SHE), when the current crosses zero (infinity
on a log scale), the projected dotted lines are required to find the
intercept indicating where the cathodic and anodic currents actually
cancel each other. The corrosion current density (i corr ) can be
obtained by dividing the anodic current by the surface area of the
specimen, 1 cm in the present case. According to the conversion
2
table presented earlier in Chap. 3 (Table 3.2), the current density of
67 µA cm evaluated in this example corresponds to a penetration
−2
rate of 0.8 mm y .
−1
The second example shows the carbon steel polarization behavior
when exposed to a deaerated solution maintained at 25°C and pH of
five. The mixed potential diagram of this system is shown in Fig. 5.15.
The shift of the E corr to a more negative value of −0.368 V vs SHE
should be noted. The modeled projected lines provide an estimate of
the corrosion current density of 4 µA cm in this case and this current
−2
translates into a penetration rate of 0.05 mm y .
-1
5.5.2 Concentration Controlled Processes
When one of the reactions is limited by the rate of transport of the
reactant to the metallic surface being corroded, the situation increases
in complexity as illustrated in the polarization plot of the system in
Fig. 5.16. The system represented here is similar to the previous one,