
Page 136 - Corrosion Engineering Principles and Practice
P. 136
110 C h a p t e r 5 C o r r o s i o n K i n e t i c s a n d A p p l i c a t i o n s o f E l e c t r o c h e m i s t r y 111
0.4
0.2
Potential (V vs. SCE) –0.2
0.0
–0.4
–0.6
–1 0 1 2 3
–2
Log (current density (µA cm ))
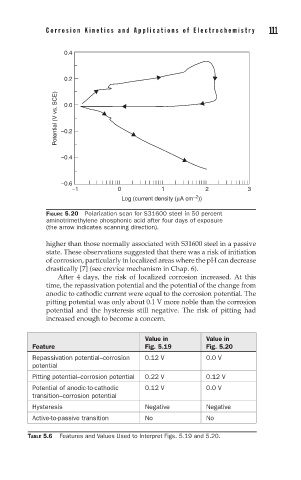
FIGURE 5.20 Polarization scan for S31600 steel in 50 percent
aminotrimethylene phosphonic acid after four days of exposure
(the arrow indicates scanning direction).
higher than those normally associated with S31600 steel in a passive
state. These observations suggested that there was a risk of initiation
of corrosion, particularly in localized areas where the pH can decrease
drastically [7] (see crevice mechanism in Chap. 6).
After 4 days, the risk of localized corrosion increased. At this
time, the repassivation potential and the potential of the change from
anodic to cathodic current were equal to the corrosion potential. The
pitting potential was only about 0.1 V more noble than the corrosion
potential and the hysteresis still negative. The risk of pitting had
increased enough to become a concern.
Value in Value in
Feature Fig. 5.19 Fig. 5.20
Repassivation potential–corrosion 0.12 V 0.0 V
potential
Pitting potential–corrosion potential 0.22 V 0.12 V
Potential of anodic-to-cathodic 0.12 V 0.0 V
transition–corrosion potential
Hysteresis Negative Negative
Active-to-passive transition No No
TABLE 5.6 Features and Values Used to Interpret Figs. 5.19 and 5.20.