
Page 425 - Corrosion Engineering Principles and Practice
P. 425
394 C h a p t e r 1 0 C o r r o s i o n i n S o i l s a n d M i c r o b i o l o g i c a l l y I n f l u e n c e d C o r r o s i o n 395
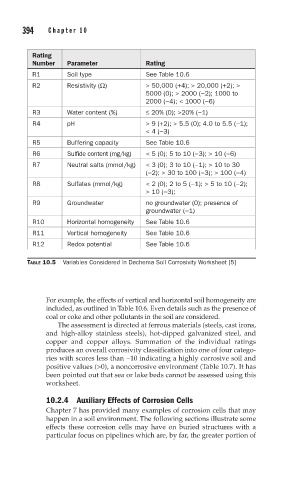
Rating
Number Parameter Rating
R1 Soil type See Table 10.6
R2 Resistivity (Ω) > 50,000 (+4); > 20,000 (+2); >
5000 (0); > 2000 (−2); 1000 to
2000 (−4); < 1000 (−6)
R3 Water content (%) ≤ 20% (0); >20% (−1)
R4 pH > 9 (+2); > 5.5 (0); 4.0 to 5.5 (−1);
< 4 (−3)
R5 Buffering capacity See Table 10.6
R6 Sulfide content (mg/kg) < 5 (0); 5 to 10 (−3); > 10 (−6)
R7 Neutral salts (mmol/kg) < 3 (0); 3 to 10 (−1); > 10 to 30
(−2); > 30 to 100 (−3); > 100 (−4)
R8 Sulfates (mmol/kg) < 2 (0); 2 to 5 (−1); > 5 to 10 (−2);
> 10 (−3);
R9 Groundwater no groundwater (0); presence of
groundwater (−1)
R10 Horizontal homogeneity See Table 10.6
R11 Vertical homogeneity See Table 10.6
R12 Redox potential See Table 10.6
TABLE 10.5 Variables Considered in Dechema Soil Corrosivity Worksheet [5]
For example, the effects of vertical and horizontal soil homogeneity are
included, as outlined in Table 10.6. Even details such as the presence of
coal or coke and other pollutants in the soil are considered.
The assessment is directed at ferrous materials (steels, cast irons,
and high-alloy stainless steels), hot-dipped galvanized steel, and
copper and copper alloys. Summation of the individual ratings
produces an overall corrosivity classification into one of four catego-
ries with scores less than −10 indicating a highly corrosive soil and
positive values (>0), a noncorrosive environment (Table 10.7). It has
been pointed out that sea or lake beds cannot be assessed using this
worksheet.
10.2.4 Auxiliary Effects of Corrosion Cells
Chapter 7 has provided many examples of corrosion cells that may
happen in a soil environment. The following sections illustrate some
effects these corrosion cells may have on buried structures with a
particular focus on pipelines which are, by far, the greater portion of