Page 720 - Corrosion Engineering Principles and Practice
P. 720

672   C h a p t e r   1 5                      H i g h - Te m p e r a t u r e   C o r r o s i o n    673


                      the Cr/Cr O  equilibrium, the Cr(g) vapor pressure may be obtained
                              2
                                 3
                      from the equilibrium expressed in Eq. (15.13).
                                     0.5 Cr O (s) =  Cr(g) 0.75 O (g)     (15.13)
                                                    +
                                           3
                                         2
                                                           2
                         The  other  lines  in  Fig.  15.4  are  obtained  by  using  similar
                      equilibrium equations (Table 15.4). The vapor equilibria presented in
                      Fig. 15.4 show that significant Cr(g) vapor pressures are developed at
                      low-oxygen  partial  pressure  (e.g.,  at  the  alloy-scale  interface  of  a
                      Cr O -forming  alloy)  but  that  a  much  larger  pressure  of  CrO (g)
                                                                             3
                          3
                        2
                      develops at high-oxygen partial pressure. This high CrO (g) pressure
                                                                     3
                      is responsible for the thinning of Cr O  scales by vapor losses during
                                                      3
                                                    2
                      exposure to oxygen-rich environments.
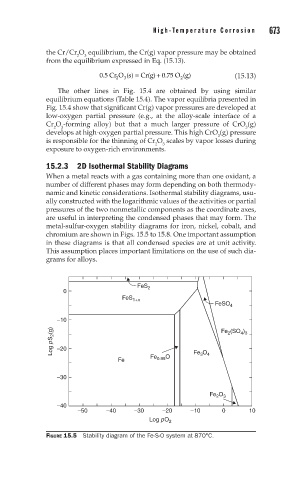
                      15.2.3  2D Isothermal Stability Diagrams
                      When a metal reacts with a gas containing more than one oxidant, a
                      number of different phases may form depending on both thermody-
                      namic and kinetic considerations. Isothermal stability diagrams, usu-
                      ally constructed with the logarithmic values of the activities or partial
                      pressures of the two nonmetallic components as the coordinate axes,
                      are useful in interpreting the condensed phases that may form. The
                      metal-sulfur-oxygen stability diagrams for iron, nickel, cobalt, and
                      chromium are shown in Figs. 15.5 to 15.8. One important assumption
                      in these diagrams is that all condensed species are at unit activity.
                      This assumption places important limitations on the use of such dia-
                      grams for alloys.


                                               FeS 2
                           0
                                           FeS 1+x
                                                                    FeSO 4

                         –10
                        Log pS 2 (g)  –20                             Fe (SO )
                                                                           4 3
                                                                        2
                                                                3
                                          Fe       Fe 0.95 O  Fe O 4

                         –30

                                                                   Fe O 3
                                                                     2
                         –40
                               –50     –40    –30     –20     –10     0       10
                                                  Log pO 2

                      FIGURE 15.5  Stability diagram of the Fe-S-O system at 870°C.
   715   716   717   718   719   720   721   722   723   724   725