
Page 261 - DSP Integrated Circuits
P. 261
246 Chapter 6 DSP Algorithms
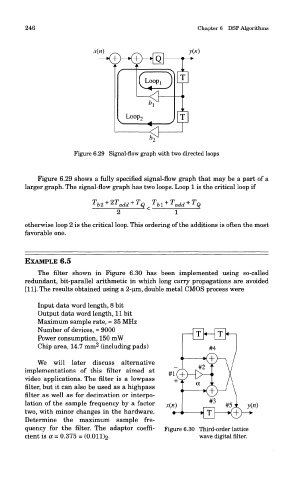
Figure 6.29 Signal-flow graph with two directed loops
Figure 6.29 shows a fully specified signal-flow graph that may be a part of a
larger graph. The signal-flow graph has two loops. Loop 1 is the critical loop if
otherwise loop 2 is the critical loop. This ordering of the additions is often the most
favorable one.
EXAMPLE 6.5
The filter shown in Figure 6.30 has been implemented using so-called
redundant, bit-parallel arithmetic in which long carry propagations are avoided
[11]. The results obtained using a 2-um, double metal CMOS process were
Input data word length, 8 bit
Output data word length, 11 bit
Maximum sample rate, ~ 35 MHz
Number of devices, ~ 9000
Power consumption, 150 mW
2
Chip area, 14.7 mm (including pads)
We will later discuss alternative
implementations of this filter aimed at
video applications. The filter is a lowpass
filter, but it can also be used as a highpass
filter as well as for decimation or interpo-
lation of the sample frequency by a factor
two, with minor changes in the hardware.
Determine the maximum sample fre-
quency for the filter. The adaptor coeffi- Figure 6.30 Third-order lattice
cient is a = 0.375 = (0.011) 2. wave digital filter.