
Page 291 - Decision Making Applications in Modern Power Systems
P. 291
Particle swarm optimization applied Chapter | 10 251
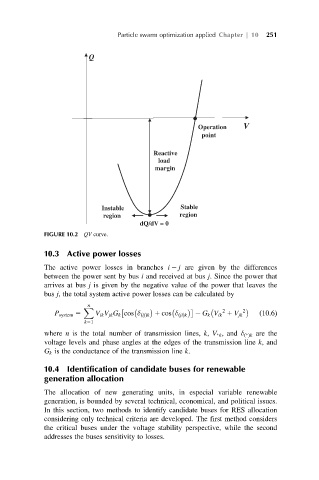
Q
Operation V
point
Reactive
load
margin
Instable Stable
region region
dQ/dV = 0
FIGURE 10.2 QV curve.
10.3 Active power losses
The active power losses in branches i 2 j are given by the differences
between the power sent by bus i and received at bus j. Since the power that
arrives at bus j is given by the negative value of the power that leaves the
bus j, the total system active power losses can be calculated by
n
X
2
P system 5 V ik V jk G k cos δ ijðÞk 1 cos δ jiðÞk 2 G k V ik 1 V jk 2 ð10:6Þ
k51
ðÞk are the
k
where n is the total number of transmission lines, k, V , and δ
voltage levels and phase angles at the edges of the transmission line k, and
G k is the conductance of the transmission line k.
10.4 Identification of candidate buses for renewable
generation allocation
The allocation of new generating units, in especial variable renewable
generation, is bounded by several technical, economical, and political issues.
In this section, two methods to identify candidate buses for RES allocation
considering only technical criteria are developed. The first method considers
the critical buses under the voltage stability perspective, while the second
addresses the buses sensitivity to losses.