
Page 296 - Decision Making Applications in Modern Power Systems
P. 296
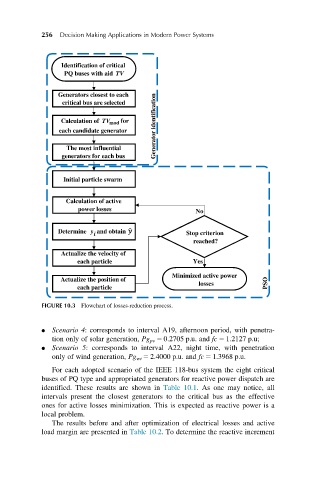
256  Decision Making Applications in Modern Power Systems


                  Identification of critical
                  PQ buses with aid  TV


                 Generators closest to each
                                           Generator identification
                  critical bus are selected
                 Calculation of  TV mod  for
                 each candidate generator

                   The most influential
                  generators for each bus


                  Initial particle swarm


                   Calculation of active
                      power losses                    No


                 Determine  y and obtain           Stop criterion
                          i
                                                     reached?
                  Actualize the velocity of
                      each particle                  Yes
                                                Minimized active power
                 Actualize the position of
                                                       losses            PSO
                      each particle
            FIGURE 10.3 Flowchart of losses-reduction process.


              Scenario 4: corresponds to interval A19, afternoon period, with penetra-
               tion only of solar generation, Pg pv 5 0.2705 p.u. and fc 5 1.2127 p.u;
              Scenario 5: corresponds to interval A22, night time, with penetration
               only of wind generation, Pg wt 5 2.4000 p.u. and fc 5 1.3968 p.u.
               For each adopted scenario of the IEEE 118-bus system the eight critical
            buses of PQ type and appropriated generators for reactive power dispatch are
            identified. These results are shown in Table 10.1. As one may notice, all
            intervals present the closest generators to the critical bus as the effective
            ones for active losses minimization. This is expected as reactive power is a
            local problem.
               The results before and after optimization of electrical losses and active
            load margin are presented in Table 10.2. To determine the reactive increment