
Page 297 - Decision Making Applications in Modern Power Systems
P. 297
Particle swarm optimization applied Chapter | 10 257
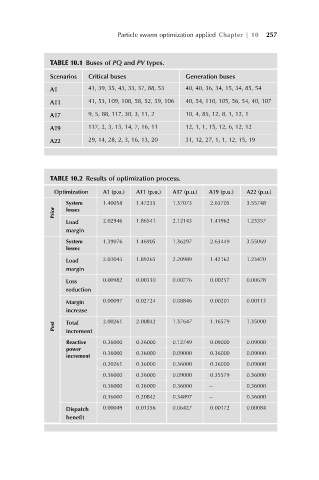
TABLE 10.1 Buses of PQ and PV types.
Scenarios Critical buses Generation buses
A1 41, 39, 35, 43, 33, 37, 88, 53 40, 40, 36, 34, 15, 34, 85, 54
A11 41, 53, 109, 108, 58, 52, 39, 106 40, 54, 110, 105, 56, 54, 40, 107
A17 9, 5, 88, 117, 30, 3, 11, 2 10, 4, 85, 12, 8, 1, 12, 1
A19 117, 2, 3, 13, 14, 7, 16, 11 12, 1, 1, 15, 12, 6, 12, 12
A22 29, 14, 28, 2, 3, 16, 13, 20 31, 12, 27, 1, 1, 12, 15, 19
TABLE 10.2 Results of optimization process.
Optimization A1 (p.u.) A11 (p.u.) A17 (p.u.) A19 (p.u.) A22 (p.u.)
System 1.40058 1.47235 1.37073 2.63705 3.55748
Prior losses
Load 2.02946 1.86541 2.12143 1.41962 1.23357
margin
System 1.39076 1.46905 1.36297 2.63449 3.55069
losses
Load 2.03043 1.89265 2.20989 1.42162 1.23470
margin
Loss 0.00982 0.00330 0.00776 0.00257 0.00678
reduction
Margin 0.00097 0.02724 0.08846 0.00201 0.00113
increase
Post Total 2.00261 2.00842 1.37647 1.16579 1.35000
increment
Reactive 0.36000 0.36000 0.12749 0.09000 0.09000
power
increment 0.36000 0.36000 0.09000 0.36000 0.09000
0.20261 0.36000 0.36000 0.36000 0.09000
0.36000 0.36000 0.09000 0.35579 0.36000
0.36000 0.36000 0.36000 0.36000
0.36000 0.20842 0.34897 0.36000
Dispatch 0.00049 0.01356 0.06427 0.00172 0.00084
benefit