
Page 302 - Decision Making Applications in Modern Power Systems
P. 302
262 Decision Making Applications in Modern Power Systems
These graphs allow one to observe the load margins and voltage levels
behavior according to the respective increase in generation and load. To
facilitate understanding, the legends present the buses in a decreasing sensi-
tivity order.
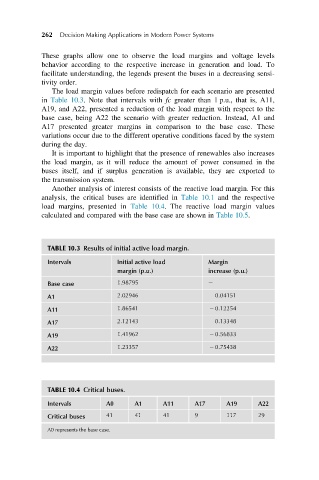
The load margin values before redispatch for each scenario are presented
in Table 10.3. Note that intervals with fc greater than 1 p.u., that is, A11,
A19, and A22, presented a reduction of the load margin with respect to the
base case, being A22 the scenario with greater reduction. Instead, A1 and
A17 presented greater margins in comparison to the base case. These
variations occur due to the different operative conditions faced by the system
during the day.
It is important to highlight that the presence of renewables also increases
the load margin, as it will reduce the amount of power consumed in the
buses itself, and if surplus generation is available, they are exported to
the transmission system.
Another analysis of interest consists of the reactive load margin. For this
analysis, the critical buses are identified in Table 10.1 and the respective
load margins, presented in Table 10.4. The reactive load margin values
calculated and compared with the base case are shown in Table 10.5.
TABLE 10.3 Results of initial active load margin.
Intervals Initial active load Margin
margin (p.u.) increase (p.u.)
Base case 1.98795
A1 2.02946 0.04151
A11 1.86541 2 0.12254
A17 2.12143 0.13348
A19 1.41962 2 0.56833
A22 1.23357 2 0.75438
TABLE 10.4 Critical buses.
Intervals A0 A1 A11 A17 A19 A22
Critical buses 41 41 41 9 117 29
A0 represents the base case.