Page 304 - Decision Making Applications in Modern Power Systems
P. 304

20
                                                                    A0
                                                                    Q
                                                                     g0
                                                                    Q
                   15                                                gmin
                                                                    A1
                                                                     pre
                                                                    Q
                                                                     g0
                                                                    Q  gmin
                   10
                  Q (p.u.)                                          A1 g0 pos
                                                                    Q
                    5                                               Q  gmin
                    0

                   –5
                     0   0.2  0.4  0.6  0.8  1  1.2  1.4  1.6  1.8
                                        V(p.u.)
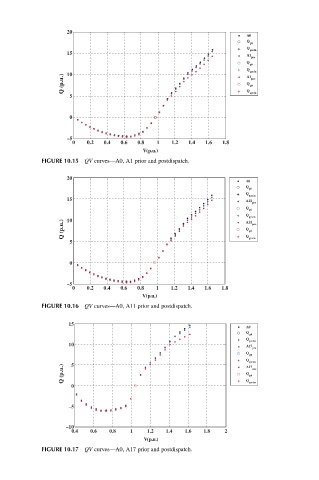
            FIGURE 10.15 QV curves—A0, A1 prior and postdispatch.

                   20
                                                                   A0
                                                                   Q
                                                                    g0
                                                                   Q
                                                                    gmin
                   15                                              A11
                                                                     pre
                                                                   Q
                                                                    g0
                                                                   Q
                                                                    gmin
                   10
                  Q (p.u.)                                         Q g0  pos
                                                                   A11
                    5                                              Q gmin
                    0
                   –5
                     0   0.2  0.4  0.6  0.8  1  1.2  1.4  1.6  1.8
                                       V(p.u.)
            FIGURE 10.16 QV curves—A0, A11 prior and postdispatch.

                    15
                                                                    A0
                                                                    Q
                                                                    g0
                                                                    Q
                                                                    gmin
                    10                                              A17
                                                                     pre
                                                                    Q
                                                                    g0
                                                                    Q gmin
                    5
                  Q (p.u.)                                          A17 g0 pos
                                                                    Q
                    0                                               Q gmin
                    –5

                   –10
                    0.4  0.6   0.8  1    1.2  1.4  1.6  1.8   2
                                        V(p.u.)
            FIGURE 10.17 QV curves—A0, A17 prior and postdispatch.
   299   300   301   302   303   304   305   306   307   308   309