
Page 301 - Decision Making Applications in Modern Power Systems
P. 301
117 2 3 13 14 7 16 11
0.98
0.97
0.96
V (p.u.) 0.95
0.94
0.93
0.92
0.91
0 0.05 0.1 0.15 0.2 0.25 0.3 0.35 0.4
Lambda
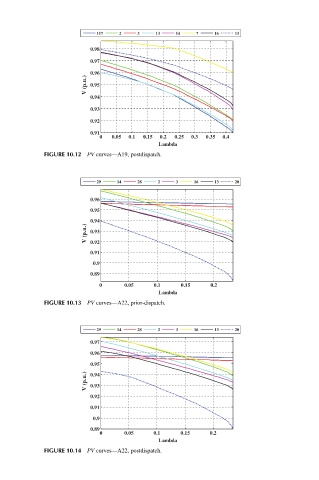
FIGURE 10.12 PV curves—A19, postdispatch.
29 14 28 2 3 16 13 20
0.96
0.95
0.94
V (p.u.) 0.93
0.92
0.91
0.9
0.89
0 0.05 0.1 0.15 0.2
Lambda
FIGURE 10.13 PV curves—A22, prior-dispatch.
29 14 28 2 3 16 13 20
0.97
0.96
0.95
V (p.u.) 0.94
0.93
0.92
0.91
0.9
0.89
0 0.05 0.1 0.15 0.2
Lambda
FIGURE 10.14 PV curves—A22, postdispatch.