Page 305 - Decision Making Applications in Modern Power Systems
P. 305

Particle swarm optimization applied Chapter | 10  265


                 7
                                                                       A0
                                                                       Q
                 6                                                      g0
                                                                       Q
                                                                        gmin
                 5                                                     A19 pre
                                                                       Q
                                                                        g0
                 4                                                     Q
                                                                        gmin
                Q (p.u.)  3 2                                          Q Q  g0 gmin
                                                                       A19
                                                                         pos
                 1
                 0
                 –1
                 –2
                  0    0.2  0.4  0.6  0.8   1   1.2  1.4  1.6   1.8
                                        V(p.u.)
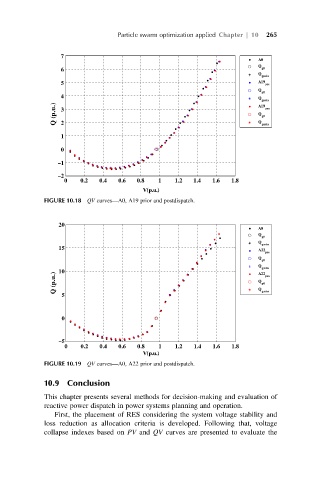
             FIGURE 10.18 QV curves—A0, A19 prior and postdispatch.


                 20
                                                                       A0
                                                                       Q
                                                                        g0
                                                                       Q
                                                                        gmin
                 15                                                    A22
                                                                         pre
                                                                       Q
                                                                        g0
                                                                       Q  gmin
                 10                                                    A22 pos
                Q (p.u.)                                               Q Q  g0
                  5                                                     gmin
                  0


                 –5
                  0    0.2  0.4  0.6  0.8   1   1.2  1.4   1.6  1.8
                                        V(p.u.)
             FIGURE 10.19 QV curves—A0, A22 prior and postdispatch.

             10.9 Conclusion
             This chapter presents several methods for decision-making and evaluation of
             reactive power dispatch in power systems planning and operation.
                First, the placement of RES considering the system voltage stability and
             loss reduction as allocation criteria is developed. Following that, voltage
             collapse indexes based on PV and QV curves are presented to evaluate the
   300   301   302   303   304   305   306   307   308   309   310