Page 299 - Decision Making Applications in Modern Power Systems
P. 299

41    39    35    43    33    37    88    53

                          1

                        0.98
                        0.96
                       V (p.u.)  0.94

                        0.92
                         0.9

                        0.88
                           0      0.2     0.4    0.6     0.8     1
                                            Lambda
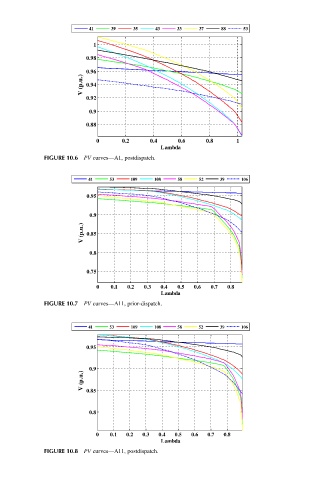
             FIGURE 10.6 PV curves—A1, postdispatch.


                         41    53   109    108   58    52   39    106

                        0.95

                         0.9
                       V (p.u.)  0.85


                         0.8


                        0.75
                           0   0.1  0.2  0.3  0.4  0.5  0.6  0.7  0.8
                                             Lambda
             FIGURE 10.7 PV curves—A11, prior-dispatch.


                         41    53   109    108   58    52   39    106

                        0.95


                         0.9
                       V (p.u.)  0.85


                         0.8


                           0   0.1  0.2  0.3  0.4  0.5  0.6  0.7  0.8
                                            Lambda
             FIGURE 10.8 PV curves—A11, postdispatch.
   294   295   296   297   298   299   300   301   302   303   304