
Page 298 - Decision Making Applications in Modern Power Systems
P. 298
258 Decision Making Applications in Modern Power Systems
in an actual power system scenario, upper and lower limits (9 36 MVar) are
adopted for the redispatch of each generator.
It is possible to verify that the dispatch of reactive power for all intervals
reached the objective function of loss reduction for the system. Analyzing
the scenarios separately, A1 obtained greater loss reduction, whereas A17
presented the greater increase of load margin. Then, comparing the gains for
each system, A17 is the scenario that presented the greater dispatch benefit.
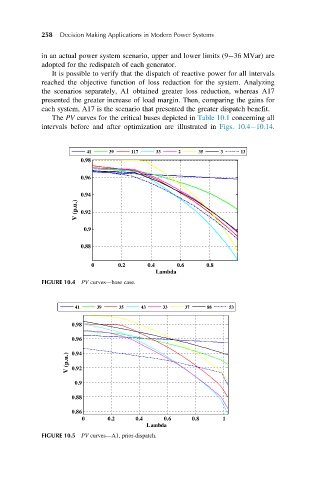
The PV curves for the critical buses depicted in Table 10.1 concerning all
intervals before and after optimization are illustrated in Figs. 10.4 10.14.
41 39 117 33 2 35 3 13
0.98
0.96
0.94
V (p.u.) 0.92
0.9
0.88
0 0.2 0.4 0.6 0.8
Lambda
FIGURE 10.4 PV curves—base case.
41 39 35 43 33 37 88 53
0.98
0.96
V (p.u.) 0.94
0.92
0.9
0.88
0.86
0 0.2 0.4 0.6 0.8 1
Lambda
FIGURE 10.5 PV curves—A1, prior-dispatch.