
Page 164 - Defrosting for Air Source Heat Pump
P. 164
158 Defrosting for Air Source Heat Pump
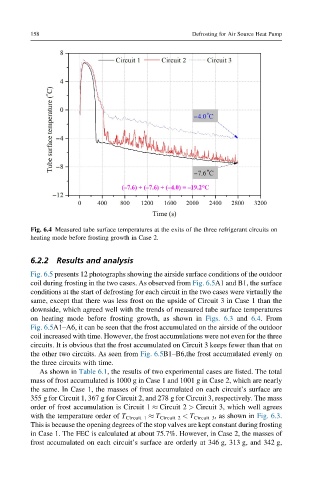
Fig. 6.4 Measured tube surface temperatures at the exits of the three refrigerant circuits on
heating mode before frosting growth in Case 2.
6.2.2 Results and analysis
Fig. 6.5 presents 12 photographs showing the airside surface conditions of the outdoor
coil during frosting in the two cases. As observed from Fig. 6.5A1 and B1, the surface
conditions at the start of defrosting for each circuit in the two cases were virtually the
same, except that there was less frost on the upside of Circuit 3 in Case 1 than the
downside, which agreed well with the trends of measured tube surface temperatures
on heating mode before frosting growth, as shown in Figs. 6.3 and 6.4. From
Fig. 6.5A1–A6, it can be seen that the frost accumulated on the airside of the outdoor
coil increased with time. However, the frost accumulations were not even for the three
circuits. It is obvious that the frost accumulated on Circuit 3 keeps fewer than that on
the other two circuits. As seen from Fig. 6.5B1–B6,the frost accumulated evenly on
the three circuits with time.
As shown in Table 6.1, the results of two experimental cases are listed. The total
mass of frost accumulated is 1000 g in Case 1 and 1001 g in Case 2, which are nearly
the same. In Case 1, the masses of frost accumulated on each circuit’s surface are
355 g for Circuit 1, 367 g for Circuit 2, and 278 g for Circuit 3, respectively. The mass
order of frost accumulation is Circuit 1 Circuit 2 > Circuit 3, which well agrees
with the temperature order of T Circuit 1 T Circuit 2 < T Circuit 3 , as shown in Fig. 6.3.
This is because the opening degrees of the stop valves are kept constant during frosting
in Case 1. The FEC is calculated at about 75.7%. However, in Case 2, the masses of
frost accumulated on each circuit’s surface are orderly at 346 g, 313 g, and 342 g,