
Page 165 - Defrosting for Air Source Heat Pump
P. 165
Frosting evenness coefficient 159
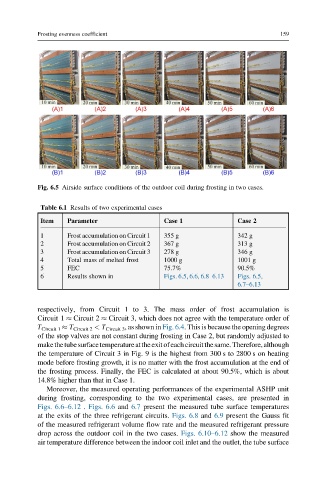
Fig. 6.5 Airside surface conditions of the outdoor coil during frosting in two cases.
Table 6.1 Results of two experimental cases
Item Parameter Case 1 Case 2
1 Frost accumulation on Circuit 1 355 g 342 g
2 Frost accumulation on Circuit 2 367 g 313 g
3 Frost accumulation on Circuit 3 278 g 346 g
4 Total mass of melted frost 1000 g 1001 g
5 FEC 75.7% 90.5%
6 Results shown in Figs. 6.5, 6.6, 6.8–6.13 Figs. 6.5,
6.7–6.13
respectively, from Circuit 1 to 3. The mass order of frost accumulation is
Circuit 1 Circuit 2 Circuit 3, which does not agree with the temperature order of
T Circuit 1 T Circuit 2 < T Circuit 3 ,as shownin Fig. 6.4. This is because the opening degrees
of the stop valves are not constant during frosting in Case 2, but randomly adjusted to
makethetubesurfacetemperatureattheexitofeachcircuitthesame.Therefore,although
the temperature of Circuit 3 in Fig. 9 is the highest from 300 s to 2800 s on heating
mode before frosting growth, it is no matter with the frost accumulation at the end of
the frosting process. Finally, the FEC is calculated at about 90.5%, which is about
14.8% higher than that in Case 1.
Moreover, the measured operating performances of the experimental ASHP unit
during frosting, corresponding to the two experimental cases, are presented in
Figs. 6.6–6.12 . Figs. 6.6 and 6.7 present the measured tube surface temperatures
at the exits of the three refrigerant circuits. Figs. 6.8 and 6.9 present the Gauss fit
of the measured refrigerant volume flow rate and the measured refrigerant pressure
drop across the outdoor coil in the two cases. Figs. 6.10–6.12 show the measured
air temperature difference between the indoor coil inlet and the outlet, the tube surface