
Page 167 - Defrosting for Air Source Heat Pump
P. 167
Frosting evenness coefficient 161
1.15
Case 1 Gauss Fit of Case 1
Measured refrigerant volume flow rate (L/M) 1.05
Gauss Fit of Case 2
Case 2
1.10
1.00
0.95
0.90
0 500 1000 1500 2000 2500 3000 3500 4000
Time (s)
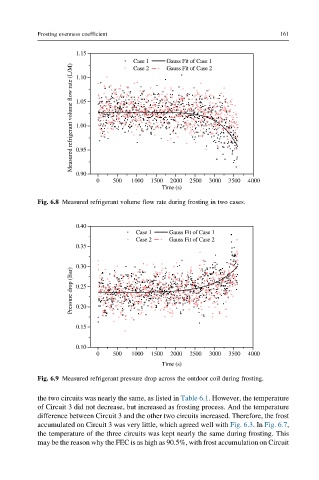
Fig. 6.8 Measured refrigerant volume flow rate during frosting in two cases.
0.40
Case 1 Gauss Fit of Case 1
Case 2 Gauss Fit of Case 2
0.35
0.30
Pressure drop (Bar) 0.25
0.20
0.15
0.10
0 500 1000 1500 2000 2500 3000 3500 4000
Time (s)
Fig. 6.9 Measured refrigerant pressure drop across the outdoor coil during frosting.
the two circuits was nearly the same, as listed in Table 6.1. However, the temperature
of Circuit 3 did not decrease, but increased as frosting process. And the temperature
difference between Circuit 3 and the other two circuits increased. Therefore, the frost
accumulated on Circuit 3 was very little, which agreed well with Fig. 6.3.In Fig. 6.7,
the temperature of the three circuits was kept nearly the same during frosting. This
may be the reason why the FEC is as high as 90.5%, with frost accumulation on Circuit