
Page 241 - Defrosting for Air Source Heat Pump
P. 241
236 Defrosting for Air Source Heat Pump
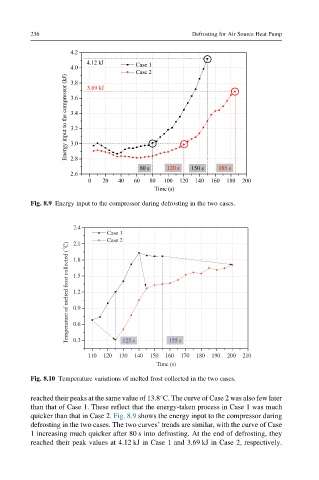
Fig. 8.9 Energy input to the compressor during defrosting in the two cases.
2.4
Case 1
Case 2
Temperature of melted frost collected ( o C) 1.5
2.1
1.8
1.2
0.9
0.6
0.3
155 s
125 s
110 120 130 140 150 160 170 180 190 200 210
Time (s)
Fig. 8.10 Temperature variations of melted frost collected in the two cases.
reached their peaks at the same value of 13.8°C. The curve of Case 2 was also few later
than that of Case 1. These reflect that the energy-taken process in Case 1 was much
quicker than that in Case 2. Fig. 8.9 shows the energy input to the compressor during
defrosting in the two cases. The two curves’ trends are similar, with the curve of Case
1 increasing much quicker after 80 s into defrosting. At the end of defrosting, they
reached their peak values at 4.12 kJ in Case 1 and 3.69 kJ in Case 2, respectively.